|
Report
from
North America
Strong mahogany use in furniture at High Point Market
More than 90% of the bedroom and dining room furniture
exhibited at the High Point Market used solid wood or
veneer according to the trade association Appalachian
Hardwood Manufacturers. The High Point Market is North
America’s largest furnishing industry trade show, where
the annual Furniture Styles and Material Use Survey was
carried out.
American cherry is the leading species used in bedrooms,
dining rooms, home offices and in entertainment cabinets,
followed by American walnut and red oak. Mahogany was
in fourth place with high levels of use in all types of
furniture surveyed.
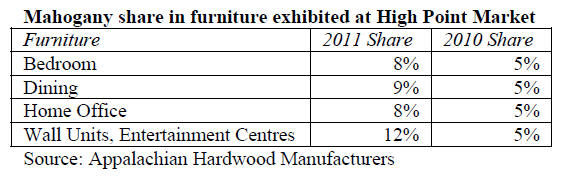
The survey results do not show what species were
included in the “mahogany” category, but the relatively
high use percentages indicate that it includes species such
as khaya.
Other tropical and subtropical species did not see much
use at the show, with the exception of plantation species
such as rubberwood and acacia, as well as wenge. The use
of materials other than wood, including painted and
overlayed wood, decreased from 12-14% in 2010 to less
than 10% this year.
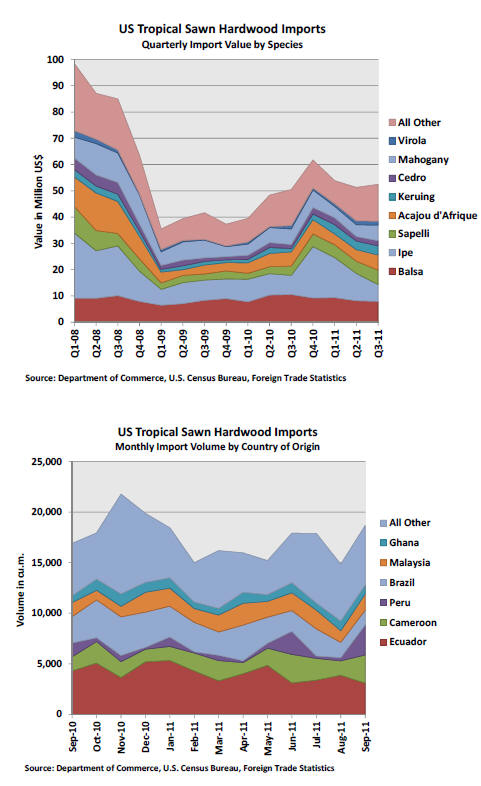
Third quarter increase in sawn tropical hardwood
imports
In the third quarter of 2011 the value of US imports of
sawn tropical hardwood increased by 2% from the
previous quarter. Imports did not reach the high levels
seen in the last quarter of 2010, but the value of year-todate
imports is still 13% above 2010. This compares to a
gain in year-to-date import volume of just 3%.
The US imported US$50.9 million of sawn tropical
hardwood in the third quarter of 2011, up from US$49.8
million in the second quarter. Among the species that
gained the most year-to-date are keruing (+110%), sapelli
(+80%), virola (+61%) and ipe (+34%).
On a monthly basis, the volume of sawn tropical
hardwood imports increased from August by 26% to
18,666 cu.m. in September. Imports of balsa were 3,063
cu.m. (-23% year-to-date), virola 2,370 cu.m. (+70% yearto-
date), acajou d’Afrique 2,267 cu.m. (-13% year-todate),
mahogany 1,284 cu.m. (-14% year-to-date), keruing
1,243 cu.m. (+83% year-to-date), and ipe 1,051 cu.m. (-
8% year-to-date).
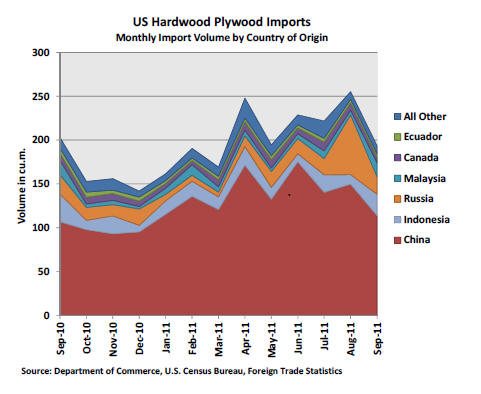
China’s share in plywood imports declined in
September
US hardwood plywood imports declined by 24% to
193,548 cu.m. in September. Year-to-date plywood
imports were unchanged from the previous year. Imports
from China were at 113,862 cu.m. (+16% year-to-date),
accounting for just 59% of total US hardwood plywood
imports in September. Imports from Indonesia were
24,296 cu.m. (-34% year-to-date), from Malaysia 16,140
cu.m. (-53% year-to-date) and from Ecuador 3,577 cu.m.
(-19%).
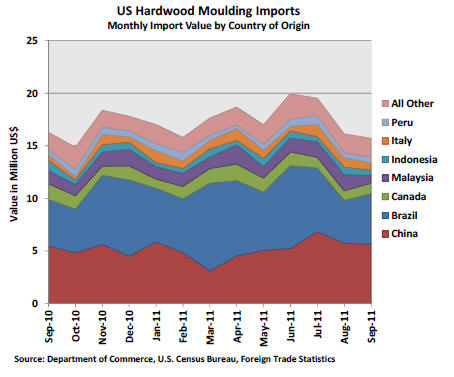
Moulding imports from China surpassed Brazil’s in
September
US imports of hardwood moulding weakened again in
September. The value of imports was US$15.7 million in
September, down 3% from the previous month. Brazilian
shipments accounted for 34% of year-to-date imports
compared to 30% from China. In September, Brazil
shipped US$4.8 million worth of hardwood moulding
(+38% year-to-date), compared to US$5.6 million from
China. Imports from Malaysia declined to US$771,000 in
September, but on a year-to-date basis Malaysian
shipments are 32% above 2010.
More hardwood flooring imported from Indonesia
Hardwood flooring imports increased by 4% to US$2.7
million in September, up 53% compared to year-to-date
2010. China regained its position as leading supplier from
Malaysia in August, but at US$851,000 imports from
Malaysia remained high nonetheless (+81% year-to-date).
China exported US$982,000 (+66% year-to-date).
Together China and Malaysia account for half of the US’
total hardwood flooring imports. Indonesia shipped
US$346,000 (+280% year-to-date), while imports from
Brazil declined to US$86,000 (-15% year-to-date).
Canadian imports of sawn tropical hardwood up in
September
Canada imported US$2 million worth of sawn tropical
hardwood in September, up 38% from August. This brings
Canadian imports back to the high levels seen in spring
and early summer.
The strong increase in imports was mainly due to higher
sapelli shipments, which reached the highest level seen so
far this year at US$526,378. Demand for mahogany was
also strong and imports reached US$208,333 in
September, up 72% from August.
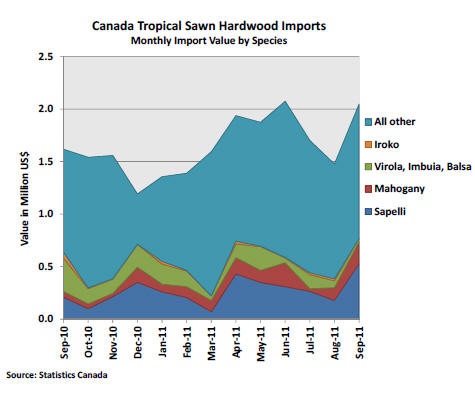
Statistic Canada revised the monthly import value data
since they were reported in the TTM report number 20.
The revised import data is shown in the graph below.
Statistics Canada distinguishes only few tropical species in
their sawnwood import data. Of the species shown, sapelli
accounts for the largest share in Canada’s tropical
sawnwood imports.
Related News:
|