US Dollar Exchange Rates of 11th February 2013
China Yuan 6.2338
Report from China
Flooring sales fall 5 percent
The Wood Flooring Commission within China’s National Forest Products
Industry Association (CNFPI) recently published data on China’s flooring
production and sales in 2012. Although the report mentions that the
available statistics are incomplete, the indications are that total
output and sales of domestically manufactured wooden flooring fell
around 5% to 377 million square metres in 2012.
Weaker than expected GDP growth, coupled with central government efforts
to reign in housing growth, have seriously affected wood flooring
manufacturers. According to the National Statistics Bureau GDP grew year
on year by 7.8 percent, the lowest rate of growth since 2000.
The flooring statistics show that output and sales of impregnated paper
laminated floor in 2012 fell 10 percent to 211 million square metres,
wood composite flooring output dropped 5 percent to 86 million square
metres, output of solid wood floors fell 2 percent to 41.7 million
square metres while output of bamboo flooring remained unchanged
compared to levels in 2011 at around 25 million square metres.
The output and sales of bamboo/wood composite, a new product category in
the statistics, was 10 million square metres.
Higher Log imports through Zhangjiagang Port in 2012
According to statistics from the Zhangjiagang Entry-Exit Inspection and
Quarantine Bureau, total log imports entering China through Zhangjiagang
Port in 2012 amounted to 2.95 million cubic metres valued at US$723
million, up 5 percent in volume and 10 percent in value on levels in
2011.
This volume of log imports represents a significant increase from the
1.78 million cubic metres imported through Zhagnjiagang Port in 2007.
Logs entering China through Zhangjiagang Port were mainly from Oceania
and Africa. The level of log imports from suppliers in Oceania was
largely unchanged from levels in 2011.
Log imports from Papua New Guinea increased (1%) to 1.36 million cubic
metres. Log imports from the Solomon Islands slipped l 8 percent to
515,600 cubic metres in 2012 compared to levels recorded in 2011.
However, log imports from the Solomon Islands have been increasing over
the past few years.
Log imports from African countries through Zhangjiagang Port totaled
797,000 cubic metres, up 33 percent year on year.
Private and foreign enterprises dominate Shandong furniture exports
According to the statistics from the Qingdao Customs, furniture and
furniture parts exports through Shandong Port in 2012 rose about 10
percent to US$1.73 billion.
In 2012 furniture exports utilising domestic timbers accounted for more
than 80 percent of total exports and were 15 percent higher than in 2011
at US$1.45 billion.
Furniture and furniture parts exports from Chinese companies utilizing
imported timber fell 13 percent to US$0.27 billion.
The EU, US, Japan and South Korea were the main export markets for
furniture and furniture parts exported through Shandong Port in 2012.
Furniture and furniture parts exports through the Port to the EU
increased 7 percent to US$560 million, exports to the US rose 9 percent
to US$540 million, exports to Japan were up 5 percent to US$260 million
and exports to South Korea grew 14 percent to US$130 million.
The value of furniture and furniture parts exports to the main markets
above accounted for around 85 percent of the total value of furniture
and furniture parts exports from Shandong Province.
Private and foreign-funded enterprises dominated Shandong furniture
exports in 2012. The furniture and furniture parts exports of these
enterprises accounted for 95 percent of the total export value of
furniture and furniture parts from Shandong Province.
Stable GDP growth amid global uncertainty in 2102
A National Bureau of Statistics of China press release provides a
summary of China’s economic performance in 2012.
see: (http://www.stats.gov.cn/english/pressrelease/t20130118_402867147.htm)
The press release says that, despite the increasingly complicated and
severe international situation, China’s national economic performance in
2012 was stable. According to preliminary data, GDP in 2012 grew 7.8%.
Growth in the first quarter was 8.1 percent, 7.6 percent for the second
quarter, 7.4 percent for the third quarter and 7.9 percent for the
fourth quarter.
Industrial production records modest growth
The total value added by industrial enterprises above a designated size
in 2012 was up approximately 10%, but rate of growth represented a 3.9%
decline on growth for 2010/2011.
Year-on-year growth of industrial production the first quarter was 11.6
percent, 9.5 percent for the second quarter, 9.1 percent for the third
quarter and 10.0 percent for the fourth quarter.
The annual growth in production by heavy industries was 9.9 percent, and
10.1 percent for the light industries. All 41 industrial categories in
the statistics registered year-on-year growth.
The growth rates in eastern, central and western regions of China were
up by 8.8 percent, 11.3 percent and 12.6 percent respectively.
Growth in fixed asset investments remain strong
In 2012, investment in fixed assets (excluding rural households) grew by
20.6% but this was a 3.4% lower rate than that in the previous year.
Investments by state-owned and state holding enterprises rose 14.7%;
private investment grew by 24.8 percent and accounted for 61.4% of total
investment.
Recorded growth in investment in the eastern, central and western
regions was 17.8 percent, 25.8 percent and 24.2 percent respectively.
Total investment in new start-ups in 2012 increased 28.6% year on year
and the number of new projects totaled 356,296, or 28,948 more than that
in 2011.
Real estate investment
Total investment in real estate development in 2012 was yuan 7,180.4
billion, a year-on-year growth of 16.2%, but this represented a decline
in the rate of expansion of 11% on growth in 2011.
Investment in residential buildings was yuan 4,937.4 billion yuan,
(+11.4%) accounting for 68.8% of all real estate investment.
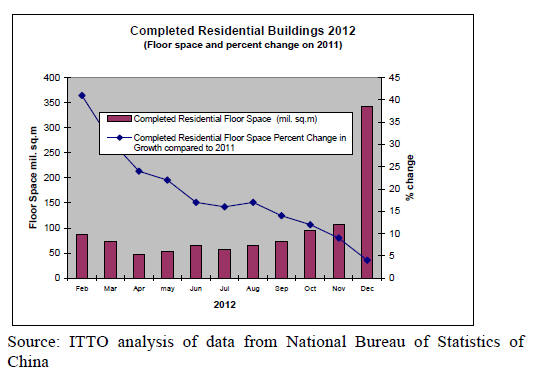
In 2012, real estate investment in the eastern region was up 13.9 percent
year-on-year, in the central region +18.3%; the western region +20.4%.
In 2012, the floor space under construction was for 5,734.18 million
square metres, up by 13.2 percent year-on-year of which, residential
floor space was up 10.6%.
Domestic demand grows at robust rate
In 2012, total retail sales of consumer goods reached 20,716.7 billion
yuan, a nominal annual rise of 14.3 percent but 2.8% lower than in 2011.
Retail sales in urban areas grew 14.3% and retail sales in rural areas
grew by 14.5%.
Sales of motor vehicles rose by 7.3%, (down 7% on 2011 growth rates);
furniture sales also +27%, but this was 5.8% down on growth rates in
2011.
Income levels chalk up double digit growth
In 2012, the per capita income of urban households was yuan 26,959 of
which the disposable income of urban households was assessed to be yuan
24,565. The nominal income growth was 12.6% just 1.2% higher than that
in 2011.
Per capita net income of rural households was reported as yuan 7,917, up
by 13.5 percent, a marginal 0.7% lower growth rate than in 2011.
The number of rural migrant workers at the end of 2012 was 262.61
million, or some 9.83 million more than in 2011. This represented an
increase of 3.9% in the number of migrant workers. The average monthly
income of a migrant worker at the end of the year was 2,290 yuan, up
11.8% in a year.
PMI falls in January but stays out of negative territory
In January, China's manufacturing Purchasing Managers Index (PMI) was
50.4, down slightly month-on-month but still above the negative.
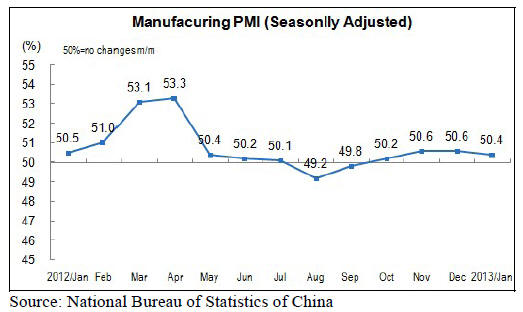
The PMI for large-sized enterprises was 51.3 (+0.2) month-on-month. This
PMI has been above the negative threshold for five consecutive months.
The PMI for medium-sized and small-sized enterprises were 49.7 and 46.2
percent below the negative threshold.
The overall PMI of enterprises in the eastern and central region were
50.9 and 51.1 percent respectively, higher than the national level. The
PMI of enterprises in the western north-eastern region were below 50 at
48.1 and 49.9, respectively.
The production indices for non-metallic mineral products, petroleum,
timber and furniture manufacturing, chemical fibre manufacturing, rubber
and plastic manufacturing and electronics, amongst others, were below
the negative threshold and output declined in 2012.
Consumer confidence fell marginally in December 2012
The National Bureau of Statistics of China has released data showing
that Consumer Confidence levels in China fell to 103.70 in December of
2012 down 1.4 points from the 105.10 November 2012 level.
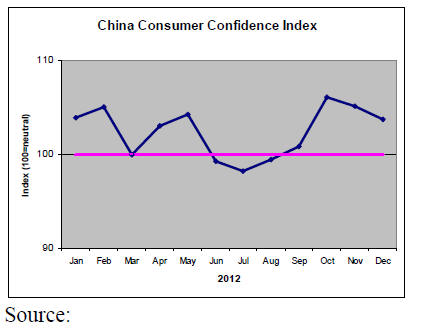
This index is compiled from surveying respondents in 20 cities throughout
China. The Index measures confidence on a scale of 0 to 200, where 200
is the most optimistic level, 0 the most negative situation and 100
neutral.
|