|
Report
from
North America
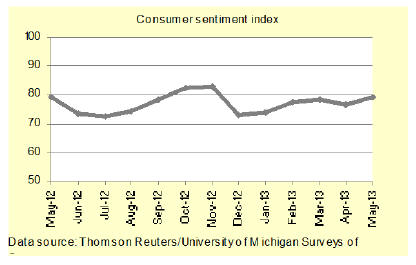
Consumers more positive about economy
Consumer confidence in the US economy went up in May,
according to the Thomson Reuters/University of Michigan
consumer sentiment index. Higher home prices and rising
stock market prices supported the more positive outlook.
Consumers plan to buy more than any other time since
2007. Households of all income levels were more
confident in the economy, but the largest gain was in highincome
households (incomes above $80,000).
Growth in manufacturing of wood products, furniture
Economic activity in the US manufacturing sector
declined in May for the first time since November 2012,
according to the Institute of Supply Management. On a
positive note, the wood product and furniture
manufacturing industries reported growth in May.
Unemployment remained essentially unchanged in April
and May. Unemployment was 7.6% in May, according to
the US Bureau of Labor Statistics.
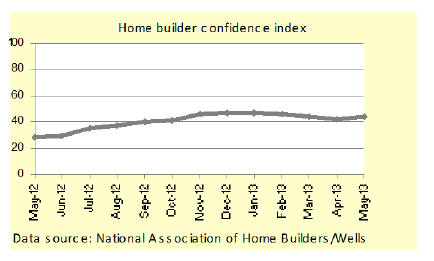
Growing demand for new homes
Builder confidence in newly built single-family homes
improved in May, according to the National Association of
Home Builders.
Higher building material costs and the lack of skilled
workers in some regions remain a challenge for builders.
However, more Americans are looking to buy a house,
while the supply of homes for sale is tight.
New home construction strongest in the Midwest
US housing starts fell to 853,000 in April at a seasonally
adjusted annual rate, down by 16.5% from the previous
month. The decline was almost entirely in multi-family
homes. The share of single-family homes in total starts
was 72%, up from just 60% in March.
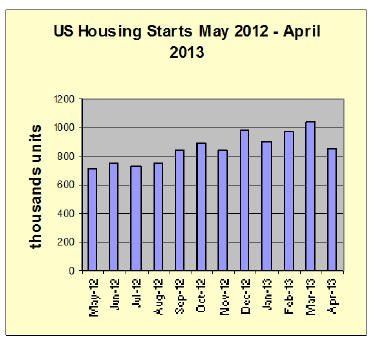
The number of building permits issued passed the onemillion
mark in April. 1.02 million permits were issued, at
a seasonally adjusted annual rate, up 14.3% from March.
The number of permits issued is usually an indicator of
future building activity.
The Midwest saw the strongest increase in housing starts
(+10.9%) and building permits (+22.3%). The Northeast
posted declines in both housing starts (-12.8%) and
building permits (-2.0%).
Home prices up
Sales of existing homes increased by 0.6% in April. The
supply of homes for sale increased, but it remains lower
than what is considered a balanced market between sellers
and buyers.
Home prices increased from March to April. The largest
gains were in cities in the West (Sacramento, Las Vegas,
San Francisco), according to the Zillow Home Value
Index.
Canadian housing starts declined in April
Canada’s housing starts declined to 176,000 in April, at a
seasonally adjusted annual rate. The value of residential
building permits issued is up, but the Canada Housing and
Mortgage Corporation does not expect a reversal of the
downward trend in construction.
The housing market remains robust, based on sales of
existing homes and home prices.
Slow recovery in non-residential construction
Spending on non-residential building construction
increased by 1.0% from March to April (at a seasonally
adjusted rate). Private construction grew by 2.2% in April.
Public construction continued to decline (-3.0%) due to
reduced government spending. Commercial buildings was
the best-performing sector within public construction.
Architectural firms with a commercial/industrial
specialization reported a decline in business conditions in
April, according to the Architecture Billings Index.
The commercial building construction market remains
variable. Institutional architecture firms reported more
steady growth, but the rate of improvement is slow.
Higher hardwood plywood and furniture imports in
April
US imports of plywood, including imports from China,
recovered in April after a steep drop in March. Furniture
imports also grew, while imports of other processed wood
products were largely stable compared to the previous
month.
Hardwood plywood imports rebounded in April after a
steep drop in March. Total hardwood plywood imports
were 264,715 m³ in April, up 33% from MarMarch. Year-todate
imports are 35% higher than in 2012.
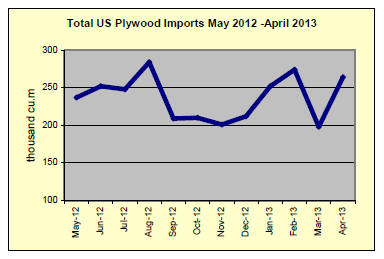
The recovery in total imports was due to higher imports
from China. China’s shipments increased from 61,058 m³
in March to 170,984 in April (+33% on a year-to-date
basis).
Imports from Indonesia fell to 31,322 m³ in April, but
year-to-date imports remain 99% above 2012. Imports
from Malaysia also decreased from March to 9,046 m³ in
April (+23% year-to-date).
Shipments from Ecuador fell to 11,871 m³ (+422% yearto-
date), but Ecuador remains the third-largest supplier of
hardwood plywood so far in 2013, after China and
Indonesia.
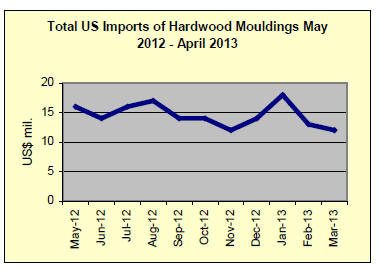
Hardwood moulding
Hardwood moulding imports increased in April following
two months of low import volumes.
The US imported $14.2 million worth of hardwood
moulding (-14% year-to-date). Imports from China
increased to $4.7 million, but year-to-date imports from
China remain 22% below 2012. Hardwood moulding
imports from Brazil decreased to $2.6 million (-28% yearto-
date).
Wood flooring
US imports of assembled flooring panels remained steady
in April at $7.2 million. However, year-to-date imports are
11% lower than in 2012. Imports from China increased
slightly but they remain far below 2012 imports. China’s
shipments were $3.3 million (-25% year-to-date).
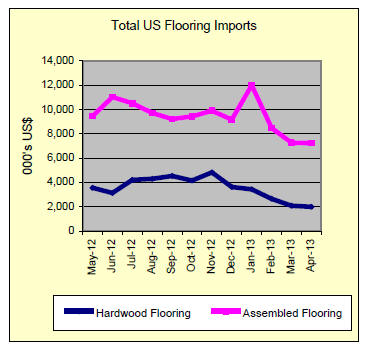
Hardwood flooring imports continued to decline and total
imports fell to just under $2.0 million in April. Year-todate
imports are still 20% higher than in 2012. Malaysian
hardwood flooring shipments to the US increased to $0.7
million in April (-35% year-to-date).
Imports from Indonesia were worth $0.5 million (+169%
year-to-date). Imports from China remained below
$200,000 (+36% year-to-date).
Wooden furniture
US imports of wooden furniture recovered from the
sudden drop in March. April imports were worth $994.5
million (+3% year-to-date).
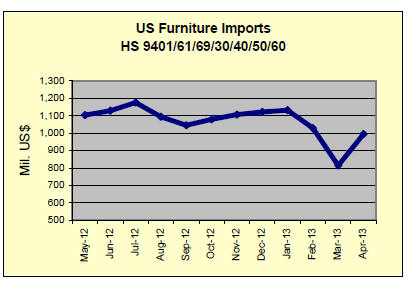
China’s furniture shipments to the US grew to $456.3
million in April (+3% year-to-date). China’s share in total
imports was 46%, up from 39% in March.
Imports from Vietnam were $147.6 million in April (+7%
year-to-date). Mexico’s shipments declined steeply in
March, but they went back up to $45.4 million in April.
March furniture orders were up by 1% year-to-date
compared to 2012, according to a monthly survey of US
furniture manufacturers and distributors (Smith Leonhard
Furniture Insights May 2013). Two-thirds of the
companies surveyed reported higher orders so far in 2013.
Furniture shipments fell by an estimated 3% compared to
March 2012. Year-to-date furniture shipments were only
1% higher than in 2012.
Furniture inventories at distributors and manufacturers
remain relatively high for business conditions. Inventories
declined by 4% in March from the previous month
towards more balanced levels.
Market outlook: Growth in home sales will support
furniture demand
The March data on new furniture orders and shipments
indicates that market conditions are stable. April and May
were more positive for manufacturers and distributors,
according to Smith Leonhard.
The High Point Market furniture show in April was very
successful for most attendees. Improving consumer
confidence and the growth in home sales will contribute to
a stronger demand for furniture.
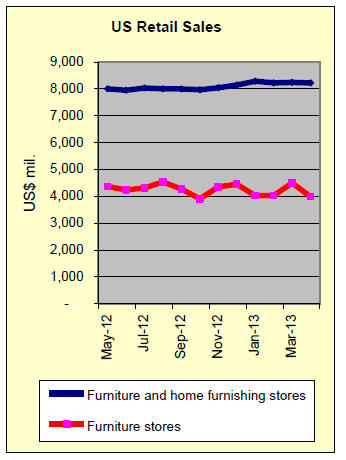
Furniture retail figures disappoint
Retail sales at furniture stores in the US fell by 11% from
March to April, according to the US Census Bureau. April
sales were $3.98 billion, when adjusted for seasonal
patterns and holidays. Furniture sales were only 1% higher
than in April 2012.
Proposed rules for formaldehyde emissions from
composite wood products
The US Environmental Protection Agency (EPA)
published the proposed rules for formaldehyde emissions
from composite wood products on May 29. The rules
apply to hardwood plywood, particleboard, MDF and
finished products containing these materials. Both
imported and domestically produced products must meet
the standards.
The proposed regulation consists of two rules:
The first rule sets the limit how much formaldehyde can
be released. It also includes testing requirements, product
labelling, and documentation and recordkeeping
requirements.
The second rule sets the third-party certification
requirements for composite panel manufacturers. EPArecognized
third-party certifiers will regularly audit
manufacturers, and conduct and verify formaldehyde
emission tests. More information about the proposed rules
is available here:
http://www.epa.gov/oppt/chemtest/formaldehyde/index.ht
ml
The EPA accepts comments about the proposed rules until
August 9, 2013.
|