|
Report
from
North America
Furniture fastest-growing manufacturing industry
Economic activity in the US manufacturing sector expanded again in June,
after a brief decline in May, according to the Institute of Supply
Management.
The fastest growing industry sector was furniture and related products.
Wood product manufacturers also reported growth.
Unemployment in the US remained unchanged at 7.6% in June, according to
the US Bureau of Labor Statistics.
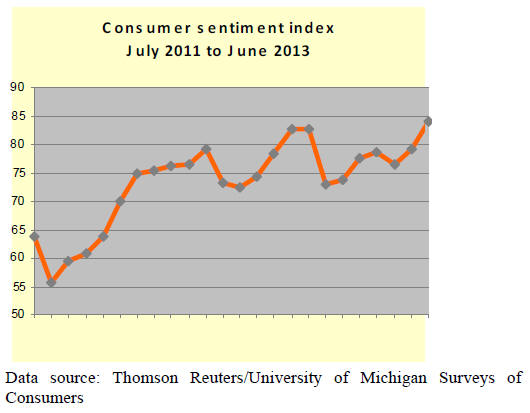
Higher home prices support consumer confidence
Consumer confidence in the US economy gained significantly in June,
according to the Thomson Reuters/University of Michigan consumer
sentiment index.
Growth in wealth (higher home values and stocks) supported the positive
economic outlook, even though jobs and wages have not improved.
Upper income households in particular were more confident in their
economic outlook. Lower income households reported declining or stable
incomes.
Confidence in the housing market also improved. Consumers thought that
conditions are favourable for both buying and selling homes.
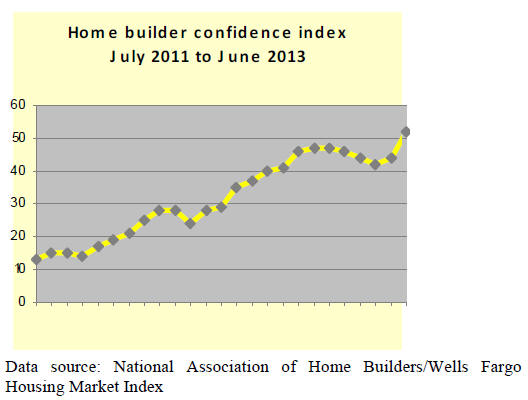
Home builders confident in single-family market
Builder confidence in newly built single-family homes improved
significantly in June. The National Association of Home Builders reports
an 8 point increase in the Home Builders/Wells Fargo Housing Market
Index. The index is over 50 for the first time since 2006.
Builders’ confidence is supported by the prospect of over 1 million
housing starts this year, a 29% increase from 2012. The supply of homes
on the market remains tight, and demand from buyers is expected to fuel
new home construction.
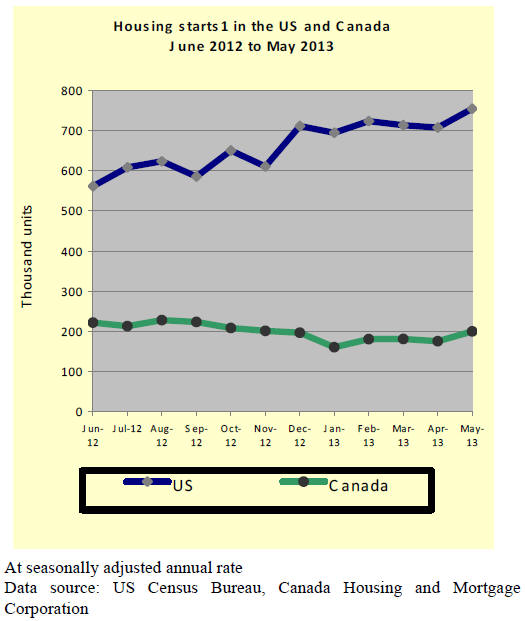
Multi-family construction up, single-family unchanged
US housing starts rose by 6.8% in May to reach 914,000 at a seasonally
adjusted annual rate. The increase was primarily in multi-family
housing. Single-family starts remained almost unchanged from the
previous month.
The US South saw the strongest increase in housing starts (+17.8%).
Starts in the West grew by 5.7%, while they declined in the Northeast
(-9.0%) and in the Midwest (-13.7%).
The number of building permits issued declined by 3.1% to 974,000 in May
(seasonally adjusted annual rate). However, single-family permits
increased by 1.2%, while the number of permits for multi-family
construction declined. The number of permits issued is usually an
indicator of future building activity.
Higher sales of existing homes
Sales of existing homes grew by 4.2% in May from the previous month,
according to the National Association of Realtors. The increase in sales
was higher than expected and the association cautioned against home
prices rising too quickly. The national median price for existing homes
sold was US$208,000 in May, 15.4% higher than in May 2012.
Canadian urban multi-family housing starts up
Canada’s housing starts increased by 14% in May, according to the Canada
Housing and Mortgage Corporation. Construction started on 200,000 units
at a seasonally adjusted annual rate. The increase in starts was mainly
in multi-family housing in the urban centres.
Sales prices of existing homes changed little between April and May, but
the average home price was 3.7% higher in May than at the same time last
year.
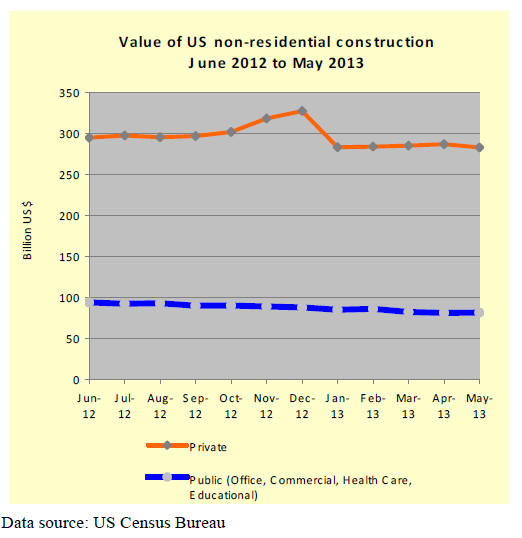
Decline in non-residential construction
Spending on US non-residential building construction declined by 1% in
May, after increasing at the same rate during the previous month (
seasonally adjusted).
Private construction decreased by 1.4%, while public construction was
almost unchanged at +0.4%. Public office construction and building of
health care facilities were the best performing sectors.
Hardwood plywood imports
All major wood product imports grew in May, with the exception of
hardwood plywood imports. It is difficult to estimate the full effect of
the anti-dumping and countervailing investigation by the US Department
of Commerce.
Without doubt the investigation’s preliminary findings and duties have
caused uncertainty in pricing and supply among hardwood plywood users in
the US.
Total hardwood plywood imports were 216,660 m³ in May, down 18% from
April. Year-to-date imports are 25% higher than in 2012.
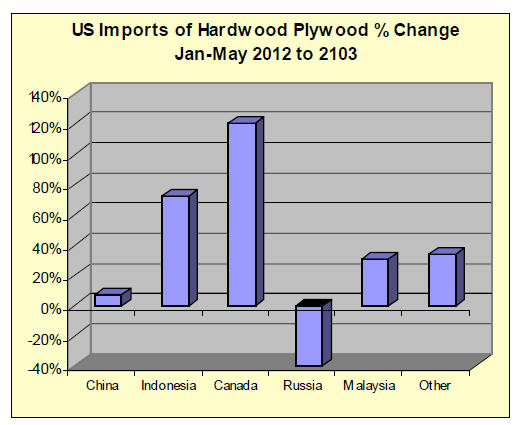
China and Indonesia, the two largest suppliers to the US market shipped
less, while imports from all other main suppliers grew, led by Canada
and Ecuador.
China’s shipments fell from 170,984 in April to 62,303 m³ in May (-64%).
However, year-to-date imports from China remain 8% higher than at the
same time in 2012.
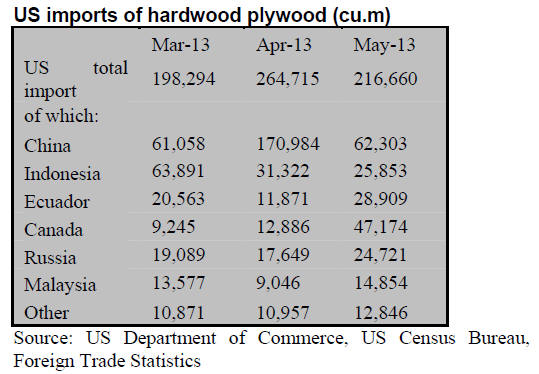
Imports from Indonesia declined by 17% to 25,853 m³ in May. Year-to-date
imports are 72% higher than in May 2012. Ecuador shipped 28,909 m³ to
the US market in May (+452% year-to-date). Canada exported 47,174 m³ of
hardwood plywood in May (+121% year-to-date).
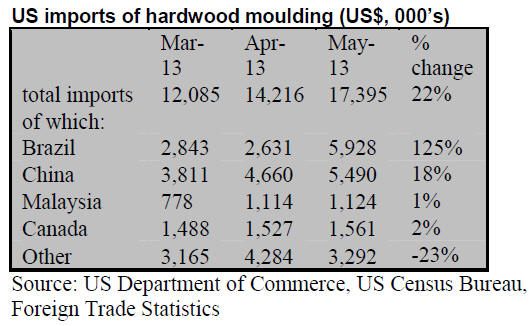
Hardwood moulding imports
US hardwood moulding imports were worth $17.4 million in May (-10%
year-to-date). Imports from China increased to $5.5 million, but
year-to-date imports from China are 12% below 2012. Brazil’s shipments
were worth $5.9 million in May (-21% year-to-date).
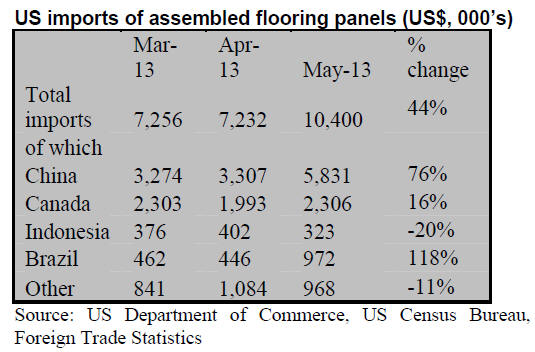
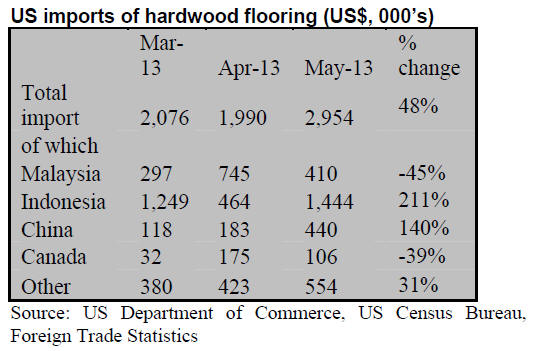
Wood flooring imports
US imports of assembled flooring panels increased to $10.4 million in
May, but year-to-date imports are still 7% lower than in 2012. Imports
from China grew significantly ($5.8 million) while Canadian shipments
increased more moderately to $2.3 million.
On a year-to-date basis, China’s shipments declined by 23%, while
imports from all other major suppliers went up.
Hardwood flooring imports also grew and reached $3.0 million in May (+9%
year-to-date). Indonesia has become the leading supplier to the US so
far in 2013. May imports from Indonesia were worth $1.4 million (+114%
year-to-date). Imports from China were $440,782 in May (+10%
year-to-date).
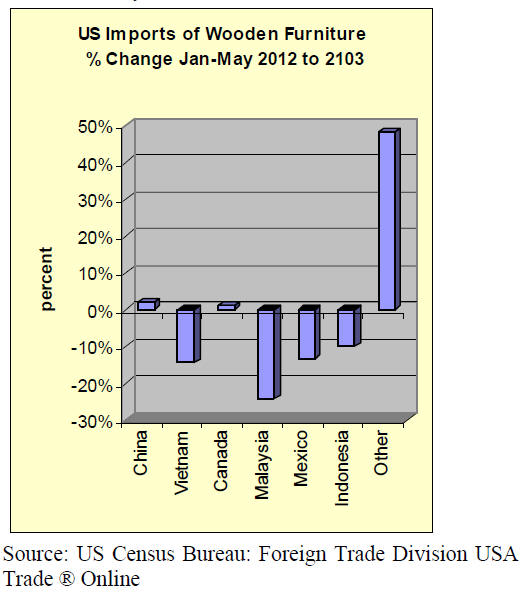
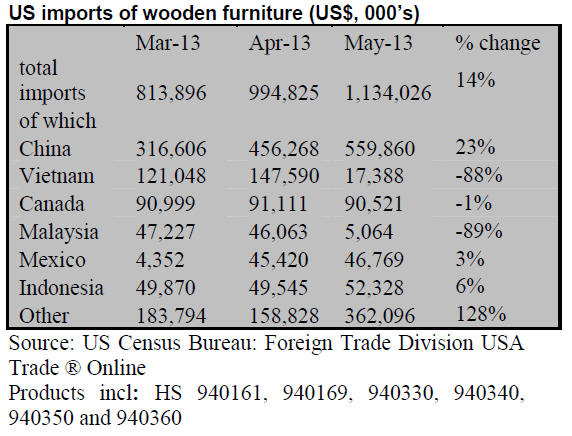
Wooden furniture imports
US imports of wooden furniture surpassed again the $1 billion mark
in May. Total imports of wooden furniture (excluding furniture parts)
were worth $1.134 billion (+3% year-to-date).
China’s market share in the US has grown so far in 2013, based on US
import figures. Furniture imports from Canada have also increased, while
imports from Vietnam, Malaysia, Indonesia and Mexico are lower than at
the same time last year.
China’s furniture shipments to the US were $595.9 million
in May (+2% year-to-date), compared to Canada’s at $90.5 million (+1%
year-to-date). Imports from Vietnam were reported at only $17.4 million
in May (-15% year-to-date).
Higher demand for engineered wood flooring
Demand for engineered wood flooring (wood veneer on a base of plywood or
HDF) is set to grow in the US, according to the National Wood Flooring
Association.
The association surveyed the industry in January 2013 and it found that
engineered wood flooring accounted for a growing share in total sales.
The growth in engineered wood flooring comes at the expense of
pre-finished solid wood flooring. Demand for unfinished solid wood
flooring appears less affected. Most engineered wood flooring is used in
remodeling project and professional contractors increasingly install it
instead of solid wood.
A market report published by Freedonia in June (Hard Surface Flooring to
2017) projects that US demand for hard surface flooring will increase by
5% per year to 2017.
However, the strongest growth will be in vinyl and tile floors, while
wood flooring will grow only moderately. In terms of end use, the
non-residential flooring market is expected to grow faster than the
residential market.
September hearing in hardwood plywood anti-dumping investigation
The US International Trade Commission has scheduled a hearing on
September 19, 2013 as part of its antidumping investigation into
hardwood plywood imports from China. The Commission will issue its final
determination within 45 days of the hearing, according to a report by
Furniture Today.
The final determination will decide whether the duties collected on
plywood imports since April 30 will continue. If the Commission does not
find evidence of injury to the US domestic plywood industry, the duties
collected so far will be refunded.
* The market information above has been generously provided by the
Chinese Forest Products Index Mechanism (FPI)
|