|
Report
from
North America
Tropical sawnwood imports down in January
Total US sawn hardwood imports increased from 57,396
cu.m in December to 62,602 cu.m in January, the increase
was mainly due to higher imports of temperate species.
Tropical sawnwood imports were 17,299 cu.m in January,
down 10% from December.
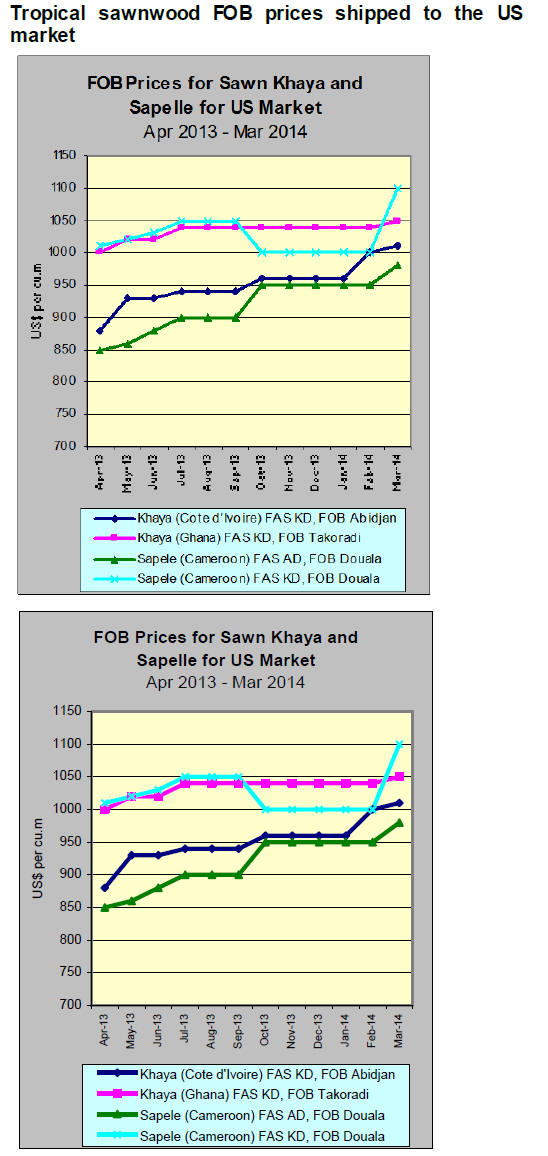
Imports from most tropical sawnwood suppliers declined
in January, with the exception of Congo/Brazzaville
(1,287 cu.m), Ghana (729 cu.m), Indonesia (720 cu.m) and
Peru (420 cu.m). Imports from Cameroon fell by 19% to
1,960 cu.m in January, with sapelli accounting for 1,355
cu.m. 834 cu.m of sapelli sawnwood were imported from
Congo/Brazzaville.
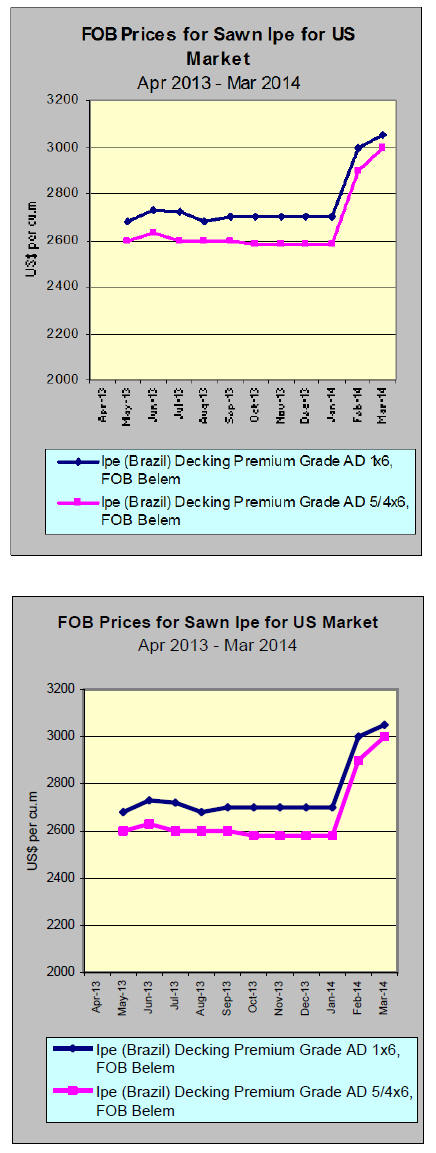
January shipments from Brazil were 3,170cu.m, down
12% from December. Ipe imports from Brazil recovered
slightly compared to the end of last year (especially
September to November) and reached 2,535 cu.m in
January.
January imports of keruing fell a huge 35% from the
previous month. Malaysian shipments were 984 cu.m in
January, while Indonesia exported 177 cu.m to the US in
January.
Imports of most other species also declined, except
mahogany (2,059 cu.m, +12%), meranti (601 cu.m,
+32%), teak (701 cu.m, +84%) and aningre (106 cu.m,
+26%).
Canada imported less from Brazil in January
Canadian imports of tropical sawn hardwood were
US$2.09 million in January, down 16% from December.
However, imports were 9% higher than in January 2013.
The largest drop was in imports from Brazil, which fell by
59% to US$409,594 in January. Imports from Indonesia
increased to US$168,280 (+14%), while there were no
imports from Malaysia in January.
The value of sapelli sawnwood imports by Canada
doubled from the previous month to US$408,353 in
January. Imports of mahogany were worth US$28,159 and
imports of virola, imbuia and balsa were worth a
combined US$336,820.
US importers say ipe supplies are very t ight this year.
Global demand is rising, while supplies of ipe are limited.
This year the rainy season has been longer than usual,
essentially shutting down the flow of ipe from Brazil.
Slightly improved demand in Europe is adding pressure on
supplies and prices.
More manufacturers offering ‘tropical’ look-alike but
non-wood decking
The market share of non-wood materials for residential
decks has grown dramat ically in the last decade. The
materials substituting for wood include wood plastic
composite, PVC and composites capped with a polymer
shell.
Non-wood decking products are popular in northern US
and along the west coast, with market shares approaching
50% in some areas in 2013. In the Southeast wood remains
the most popular decking material, with approximately 80-
90% of all decks are built in wood.
The leading manufacturers of non-wood decking are
increasingly offering products that are made to look like
tropical wood species, perhaps in an effort to gain a larger
market share in the US South.
Home owners in the Southeast prefer dark, tropical colours
in decking according to market information by TREX, the
largest manufacturer of composite decking. Tropical wood
colours and patterns are also popular in Southwestern US,
where composite decking is more established.
Several producers of composite and PVC decking have
introduced tropical look-alike product lines in 2014, such
as AZEK Building Products who announced in March
three ‗tropical‘ colours.
TimberTech (owned by the same company as AZEK)
emulates the look of ipe in its latest tropical collect ion of
capped composite decking. Advanced Environmental
Recycling Technologies (AERT) offers capped composite
decking in the colours ‗Ipe‘ and ‗Bra zilian chestnut‘.
The colour and name choices reflect the popularity of ipe
in the US decking market, and the use of non-wood
decking the US South may increase in part because of
limited ipe supplies from Brazil.
While the construction and renovation market has not yet
fully recovered from the recession, demand for decking
materials is likely to grow substantially in the coming
years. Demand for tropical species is likely to outstrip
supply and drive up prices which will provide market
opportunities for composite decking manufacturers.
Siding market study predicts good demand growth
Siding demand is mainly driven by new home construction
since almost every house and multi-family building in the
US has siding (exterior cladding). In 2013, however, repair
and renovation were the leading markets for siding
because new home construction was still at relatively low
levels.
Freedonia published a siding market study in March
(Freedonia Study 3144) that forecasts an annual growth of
7% in siding demand in the next five years.
Freedonia expects a strong rebound in US housing starts
and in the construction of hotels, resorts, offices and
commercial buildings, which will support demand for
siding.
Non-wood materials have dominated the siding market for
many years now. Wood siding had a market share of less
than 10% in 2013. Vinyl is the leading material with 27%
of the market in 2013, but other materials (brick, stone and
concrete) are expected to gain market share in the next
five years at the expense of vinyl.
|