|
Report from
North America
Wooden furniture imports at highest level since
beginning of US recession
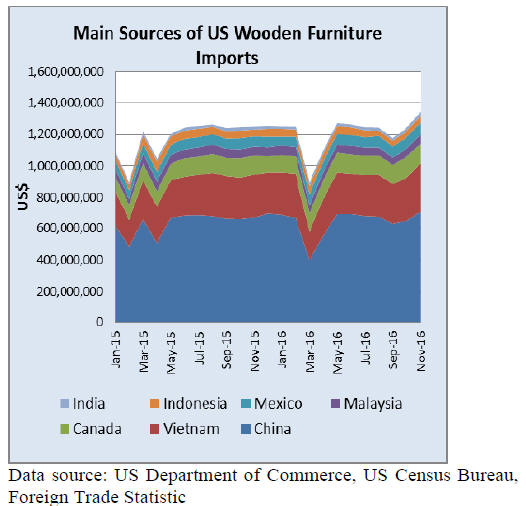
Wooden furniture imports increased 8% in November to
US$1.53 billion, the highest level since the recession.
Year-to-date imports were up 2% from November 2015.
Imports of all types of furniture increased in November
with the strongest monthly growth in wooden bedroom
furniture and upholstered seats with wooden frames.
Furniture imports from most countries grew in November
with the exception of Canada. However, year-to-date
imports from Canada grew 10% compared to 2015, helped
by the weaker Canadian dollar in 2016.
Only India had (+12%) an even higher growth rate in yearto-
date imports. Imports from India were worth US$24.1
million in November, under 2% of total wooden furniture
imports.
Furniture imports from China reached US$708.1 million
in November, up 9% from October. VietnamˇŻs shipments
grew 12% to US$311.0 million. Imports from Malaysia
and Indonesia increased significantly in November (to
US$60.3 million and US$42.4 million, respectively), but
year-to-date imports remain below 2015 levels.
Hardwood plywood imports decline for fifth
consecutive month
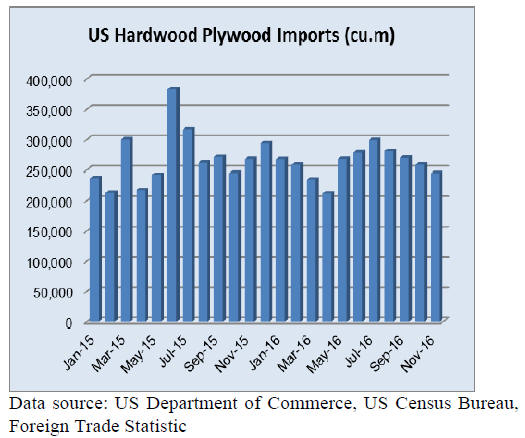
Hardwood plywood imports declined for the fifth
consecutive month in November to 244,850 cu.m. The
value of plywood imported in November was US$143.8
million, down 7% from the previous month.
Most countries shipped less plywood to the US in
November with the exception of Canada and Russia.
Imports from China fell 14% month-over-month to
140,970 cu.m. Year-to-date imports from China were still
2% higher than in November 2015.
Plywood imports from Indonesia declined to 18,981 cu.m.
in November, but the value of imports grew 3% from
October.
India second-largest tropical veneer supplier
Tropical hardwood veneer imports were almost unchanged
in November from the previous month at US$3.5 million.
Year-to-date imports were up 21% from the same time in
2015.
Italy was the leading supplier of tropical veneer in
November at US$1.2 million. Imports from India declined
from the previous month, but at US$258,824 India was the
second-largest source of tropical veneer in November.
Imports from Cote dˇŻIvoire increased 39% from October
to US$240,594.
Moulding imports continue downward trend
Imports of hardwood mouldings were worth US$14.5
million in November, down 8% from the previous month.
Year-to-date imports were 4% below November 2015.
Moulding imports from Brazil and Malaysia decreased
from October. BrazilˇŻs shipments of hardwood mouldings
to the US market were worth US$3.7 million in
November. Imports from China were US$4.3 million, up
9% from October.
Year-to-date imports from Brazil and China were down
from November 2015, while imports from Canada and
Malaysia increased.
Higher engineered flooring imports from Indonesia but
lower imports of hardwood flooring
Imports of hardwood flooring and assembled flooring
panels declined in November from the previous month.
Hardwood flooring and assembled flooring panel imports
were worth US$3.6 million and US$14.9 million,
respectively in November. Year-to-date imports of
assembled panels were up 18% compared to the same time
in 2015, while hardwood flooring imports were down from
the previous year.
Hardwood flooring imports from Malaysia grew 60%
month-on-month, but both Malaysia and Indonesia lost US
market share in 2016 to China and Canada. At
US$737,291, Indonesia was the largest source of
hardwood flooring supply in November, but year-to-date
imports from Indonesia were lower than in 2015.
Imports of assembled flooring panels from Indonesia and
Brazil increased in November. Indonesian shipments of
flooring panels soared 57% month-on-month to US$1.3
million. Year-to-date imports from Indonesia were up 9%
from November 2015.
Flooring panel imports from China fell 20% in November,
but China still accounted for over 40% of all US flooring
panel imports.
2016 ends with positive economic indicators
GDP increased at an annual rate of 3.5% in the third
quarter of 2016, based on the third estimate by the Bureau
of Economic Analysis.
The unemployment rate was slightly down in December at
4.7%, according to the US Bureau of Labor Statistics. In
the fourth quarter of 2016 both the unemployment rate and
the number of unemployed people declined, after showing
little change earlier in the year.
Economic activity in the manufacturing sector expanded in
December and the overall economy grew for the 91st
consecutive month, according to the Institute of Supply
Management. Furniture and related products
manufacturing shrank in December, while activity in wood
product manufacturing was unchanged from the previous
month.
Consumers optimistic and divided
In January 2017, consumer confidence remained
unchanged from the peak levels recorded in December by
the University of Michigan consumer confidence index.
Current economic conditions were seen as the most
positive since 2004. Expectations about the economy
declined from December but remained high.
Optimism about the US economy soared after the election
in last November, but consumers were more partisan than
any other time in the last fifty years. A higher share than
ever of respondents provided divergent comments about
government policies and economic news.
The partisan divide on the economic expectations index
was higher in January than ever before, indicating either
strong economic growth or a recession in the near future.
The non-partisan consumers were on average positive
about the economy in the coming year.
Housing starts up 5% in 2016
Residential home construction increased 5% in 2016 from
the previous year. An estimated 1,166,400 housing units
were started in 2016. Single-family starts were up 9% in
2016, while multi-family declined slightly from the
previous year.
In December housing starts grew 11% at a seasonally
adjusted annual rate, according to the US Department of
Housing and Urban Development and the Commerce
Department.
BuildersˇŻ confidence in the market for new single-family
homes was almost unchanged in January. According to the
National Home Builder AssociationˇŻs Chairman, builders
expect that a new federal government will help create a
better business climate for small businesses.
The National Home Builder Association expects a 10%
growth in single-family construction in 2017.
The number of building permits issues, which indicates
future building activity, were unchanged in December
from the previous month. Single-family permits increased,
while permits for multi-family construction declined in
December.
Sales of existing homes sales declined in December, but
2016 as a whole was the best year in a decade, according
to the National Association of Realtors. December sales
were down because of low supply levels and affordability
issues for first-time homebuyers. The average rate on a 30-
year mortgage was 4.30% in late December, the highest
rate since April 2014 according to Freddie Mac, the
Federal Home Loan Mortgage Corporation.
Final ruling on formaldehyde emissions for composite
wood products
The US Environmental Protection Agency has issued a
final rule to implement the Formaldehyde Standards for
Composite Wood Products Act.
The final rule includes formaldehyde emission standards
applicable to hardwood plywood, medium-density
fiberboard, and particleboard, and finished goods
containing these products, that are sold, supplied, offered
for sale, or manufactured (including imported) in the
United States. The rule is effective February 10, 2017.
The American Wood Council supports this new rule and
asks the new federal government to enforce it. The
association expects the rule to strengthen US wood
products manufacturing by creating a consistent system for
wood products manufactured in and imported into the US.
The American Wood Council represents about 75% of the
wood product industry in the US.
See: https://www.epa.gov/newsreleases/epa-issues-final-ruleprotect-
public-exposure-formaldehyde
|