|
Report from
North America
Department of Commerce upholds complaint ¨C
duties
slapped on Chinese cabinet imports
In February this year the US Department of Commerce
announced affirmative final determinations in the
antidumping duty (AD) and countervailing duty (CVD)
investigations of imports of wooden cabinets and vanities
from China. The petitioner in this case is the American
Kitchen Cabinet Alliance.
Commerce determined that producers and/or exporters
from China have sold wooden cabinets and vanities at less
than fair value in the United States at rates ranging from
4.37 percent to 262.18 percent.
In addition, Commerce determined that producers and/or
exporters from China received countervailing subsidies at
rates ranging from 13.33 percent to 293.45 percent. In
2018, imports of wooden cabinets and vanities from China
were valued at an estimated $4.4 billion.
The US Department of Commerce has recently issued
final duty determinations on Chinese imports of wooden
cabinets and vanities. Antidumping and countervailing
duties are as follows: Dalian Meisen 269.91%, Foremost
122.1%, Ancientree 13.33%, with all others 58.89%.
This means that almost all Chinese manufacturers will
now face a combined AD/CVD cash deposit rate of about
59%.
In October 2019 preliminary antidumping duties ranging
from 4.49% to 262.18%, with most Chinese producers
facing antidumping duties of 39.25% were imposed.
These antidumping duties are in addition to earlier
countervailing duties averaging 16%, which have been in
effect since August 2019. As a result of this final decision,
cash deposits will continue to be required on all wooden
cabinets and vanities imported from China.
See:
https://www.trade.gov/press-release/us-departmentcommerce-inds-dumping-and-countervailable-subsidizationimports-wooden
and
https://www.woodworkingnetwork.com/news/woodworkingindustry-news/commerce-rules-favor-cabinetmakers-issue-finalduties-chinese-imports
Home Construction trends depending on political
leaning of residents says NAHB
While the population of the U.S. is almost evenly split
between ˇ°redˇ± (Republican-leaning) and ˇ°blueˇ±
(Democratic-leaning) counties, the same is not true for the
distribution of single-family and multifamily construction.
A web-release from the National Association of Home
Builders (NAHB) has highlighted differences in housing
trends which appear to be related to the political leaning of
residents in the different counties in the US.
The NAHB data found that 61% of single-family
construction is in predominantly red (Republican
counties), while almost 64% of multifamily construction
has been in the blue (predominantly democrat counties).
The ˇ®blue counties tend to feature greater population
density, and this, according to the NAHB could explain
the difference.
Additionally, the NAHB reports growth rates for home
construction differ between ˇ®redˇŻ and ˇ®blueˇŻ are different
saying ˇ° Looking at four-quarter moving averages of yearover-
year growth rates for single-family construction as of
the end of 2019, red counties posted growth of 1.7% for
single-family home building, while blue counties posted a
decline of 1.2%.ˇ±
See:
http://eyeonhousing.org/2020/03/red-counties-outperformblue-counties-for-home-construction/
Manufacturing improved in February, but corona virus
having an impact
Economic activity in the manufacturing sector grew in
February and the US economy grew for the 130th
consecutive month according to the latest Manufacturing
ISM Report On Business.
ISM data indicates that 14 of 18 US manufacturing
industries expanded in February but that there are signs of
growth slowing due to heightened risks from the spread of
corona virus. Leaders in growth were the wood products
and furniture manufacturing industries. Manufacturing
production and export orders showed growth for the
month, while new orders and hiring showed a decline.
The ISM writes that disrupted supply chains are impacting
US companies.
See:
https://www.instituteforsupplymanagement.org/ismreport/mfgrob.cfm?SSO=1
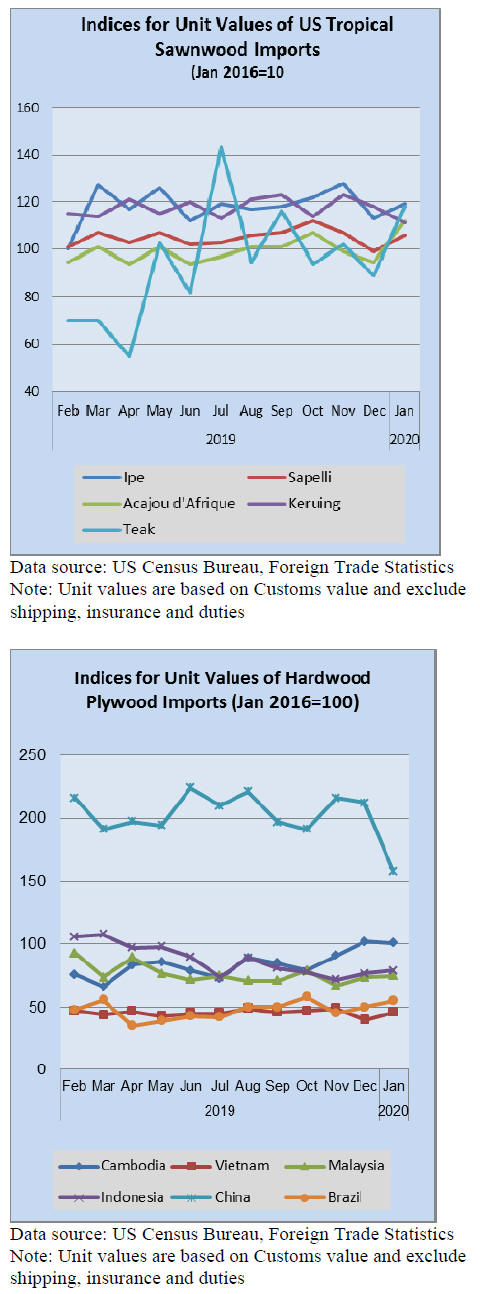
US tropical hardwood imports ¨C a slow start in 2020
U.S. imports of sawn tropical hardwood fell by grew by
22% in January. With only 14,520 cubic metres imported,
January was the slowest month in four years and was 44%
behind January 2019. Imports from Brazil held steady
from December totals, but were only half of last JanuaryˇŻs.
Imports from Ecuador and Cameroon were also well
below last monthˇŻs and last yearˇŻs volume.
U.S. Imports of Balsa fell by 64% in January, the lowest
level in more than 10 years. Imports of Sapelli, Cedro and
Teak were also off sharply in January.
Hardwood plywood imports up 20%
US imports of hardwood plywood rose 3% in 2019
January. The monthˇŻs total was 234,113 cubic metres, a
level 20% higher than that of January 2019. Imports from
China grew by 78% in January, but still trail levels from a
year ago by a third. Imports from Malaysia and Indonesia
both rose in January and are well ahead of 2019 levels.
Imports from Vietnam fell by 15% in January.
US tropical veneer imports slide
US Imports of tropical hardwood veneer fell by 5% in
January as markets became more volatile. Imports from
India nearly tripled after three weak months and imports
from China more than doubled.
Meanwhile imports from Ghana were down 99% and
shippers in Cameroon appeared to pick up the slack, rising
by 46%. Overall, January imports of tropical veneers
lagged the previous yearˇŻs totals by 24%.
Flooring imports recover
US imports of hardwood flooring rose by 10% in January,
recovering from four straight months of decline. Despite
the gain, January totals still trail January 2019 numbers by
22%. While imports from China rose 87% and imports
Malaysia grew nearly 250%, the monthly totals from those
two countries are still well behind totals from a year ago.
Imports of assembled flooring panels grew by 27% in
January, with imports from Southeast Asia showing the
strongest growth. Imports from Vietnam more than
doubled in January while imports from Indonesia and
Thailand both grew sharply. Imports from China rose 3%
but remain 35% behind those of January 2019.
Strong start to 2020 moulding imports
US imports of hardwood mouldings jumped 33% in
January after three months of decline. Imports were
slightly above numbers from last January as imports grew
from nearly all trading partners. Imports from Canada
grew by 39% in January and were 18% better than
numbers from a year ago.
|