|
Report
from
Europe
Slowing German economy drags down EU growth
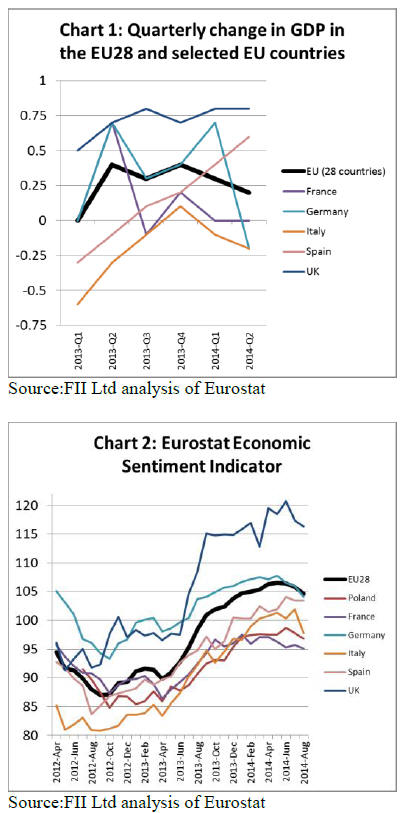
The EU28 group of nations recorded only 0.2% GDP
growth in the second quarter of 2014, down from 0.3% in
the first quarter (Chart 1). The slowdown was largely due
to contraction in Germany, Europe's biggest economy.
After expanding 0.7% in the first quarter of 2014,
Germany‟s economy slipped 0.2% in the second quarter of
the year as foreign trade and investment, particularly in the
construction sector, weighed on growth. Meanwhile
France recorded zero growth for the second quarter in a
row between April and June 2014, while Italy‟s economy
continued to contract.
Investor and business confidence in central and east
Europe has been undermined because of the crisis in
Ukraine - straining relations with Russia - raising fears of
an even weaker recovery because of the threat of
deepening sanctions.
There was better news from Spain where the recovery has
continued to gather pace this year, with GDP expanding
0.6% in the first quarter.
However, the UK is currently the strongest performer of
large European economies, with GDP growth of 0.8% in
both the first and second quarters of 2014.
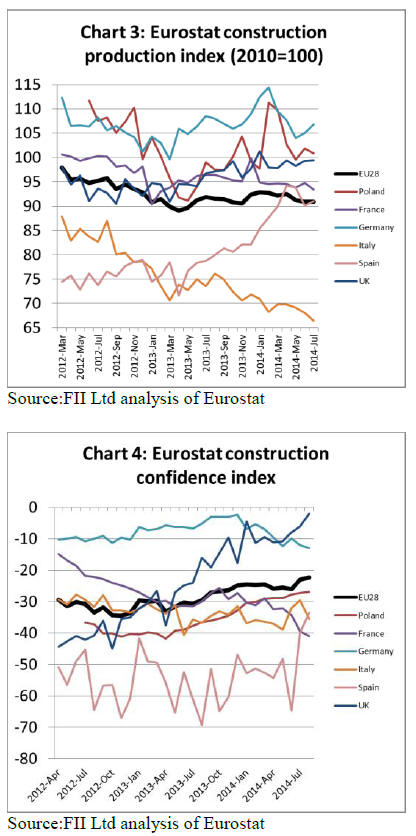
Trends in GDP growth are mirrored in Eurostat‟s
Economic Confidence Indicator (ECI), a forward-looking
index that measures perceptions and expectations in five
surveyed sectors (industry, services, retail trade,
construction and consumers) in all EU Member States.
The ECI for the EU as a whole was still over 100 in
August �C indicating above average economic sentiment.
However the ECI was declining between June and August
this year. The decline is apparent in all the major EU
economies with the exception of Spain.
Overall economic sentiment remains strong in the UK,
moderate in Germany and Spain, but weak and declining
in France, Italy and Poland (Chart 2).
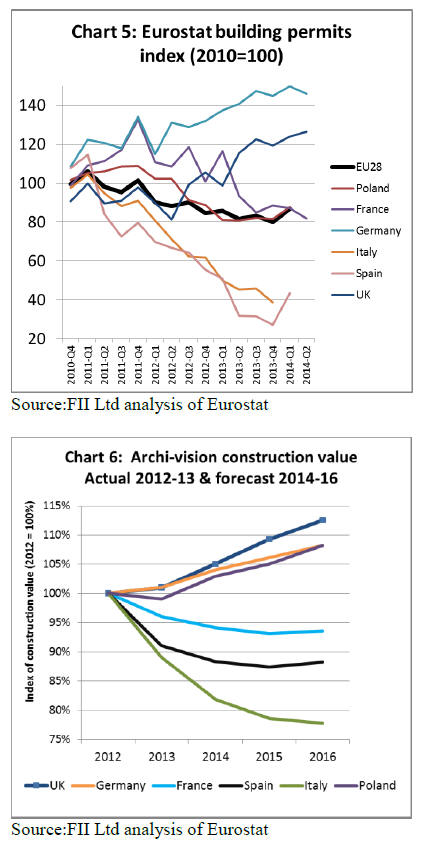
European construction flat at a low level
Although overall European construction activity hit
bottom in March 2013, it has risen only slowly since then
(Chart 3). Activity was strengthening to February this year
but has dipped again since April. The Eurostat.
Construction Confidence Index in the EU is still in
negative territory, indicating that many in the industry still
expect market conditions to deteriorate rather than to
improve in the next 3 months. However the trend in
market sentiment is gradually improving (Chart 4).
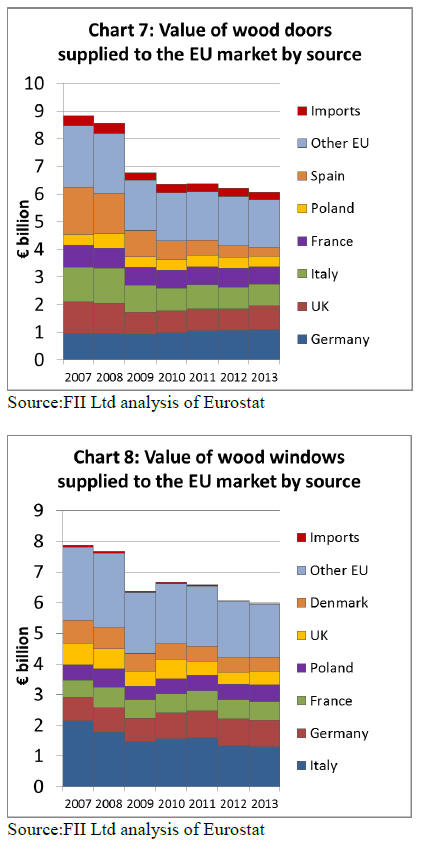
The latest EU-wide data for building permits shows that
these were declining until the last quarter of 2013 but
experienced an upturn in the first quarter of 2014 (Chart
5).
Rapid improvement in UK construction
Construction industry trends in 2014 have varied widely
between EU countries. The UK stands out this year as a
country where construction is recovering very rapidly. The
UK Construction Products Association (CPA) Summer
Forecasts suggest that total construction output will grow
by 4.7% in 2014 and a further 4.8% in 2015.
Furthermore, this expansion should continue with total
construction output forecast to rise 22.2% over the next
five years. In the 12 months of end of June this year, UK
housing starts were nearly 138000, 22% up on the
previous year and the highest level of house building since
2007. Private housing starts are now expected to grow
18% during 2014 and 10% in 2015.
Commercial construction in the UK has also seen a
significant resurgence in 2014. This is mainly due to big
ticket projects in London, although there are now also
signs of improving activity in other parts of the country.
The CPA expects commercial offices output in the UK to
grow 10% in 2014 and 8% in 2015.
The CPA‟s forecasts are slightly more optimistic than
those of the 2nd quarter Archi-vision survey of 1600
architects across Europe.
For the UK, Arch-Vision predict 4% growth of the UK
construction market in 2014 with this rate of growth
continuing in 2015 (+4%) and slowing to +3% in 2016
(Chart 6).
Slowdown in German and Polish construction in 2nd
Quarter
Construction activity in Germany and Poland has been
relatively robust compared to other European countries in
recent years. However seasonally-adjusted activity in both
countries fell away dramatically in the second quarter of
2014.
This seems to be primarily the result of the mild winter
which meant that many projects were brought forward into
the first quarter. There are indications that construction
activity in both countries will recover in the second half of
2014.
The 2nd quarter Archi-vision survey shows that architects‟
order books and turnover development in both Germany
and Poland were positive in the second quarter of 2014,
suggesting plenty of new building projects in the pipeline.
Archi-vision forecast continued slow growth in
construction activity in both countries between 2014 and
2016 (Chart 6)
Construction activity in Spain has been regaining strength
since the start of 2013. The Archi-vision survey indicates
two positive quarters for Spanish construction in a row in
the first half of 2014 as more architects report increasing
order books. Residential building permits have also been
rising in Spain this year for the first time since the
recession.
However, government austerity is still a major constraint
in Spain and building permits for non-residential
construction have fallen again this year. Arch-Vision
forecast that Spanish construction activity will decline 3%
in 2014 and a further 1% in 2015, but will recover by 1%
in 2016 (Chart 6).
Depressed construction in Italy
Construction activity in Italy remains depressed. The
construction production index for Italy continued to
decline to July 2014 and is now only 65% of the level of
2010 (Chart 3). The latest data for Italian building permits
shows these falling sharply during 2013.
The Archi-vision survey shows that, after several bad
quarters in 2013, Italian architects experienced another big
drop in order book and turnover development in the
second quarter of 2014.
The confidence indicator for Italian construction is stable,
but at a low level (Chart 4). Therefore the outlook for the
next twelve months is not promising. Archi-Vision predict
that the Italian construction market will fall by 8% in 2014
and a further 4% in 2015. The decline might then level off
in 2016.
Construction activity in France declined sharply at the end
of 2014 and confidence in the sector remains low. The
Archi-vision survey indicated a sharp fall in architect‟s
order books in the fourth quarter of 2013.
The Construction Confidence Indicator for France has
continued to fall this year (Chart 4). However, other
indicators suggest the market may be close to bottom.
French building permits for residential buildings showed a
negative trend for the whole of 2013, but stabilised in the
first two quarters of 2014. Building permits for nonresidential
construction registered a slight increase. Archi-
Vision forecast that French construction activity will
decrease in 2014 (-2%) and 2015 (-1%), but will stabilise
from 2016 onwards.
Slow improvement in Dutch and Belgian construction
There are signs of improving construction activity in the
Netherlands. The Archi-vision survey indicates that order
books and turnover for architects in the country increased
in the second quarter of 2014, the third consecutive quarter
of growth.
Other indicators suggest gradual improvement in both
residential and non-residential construction in the
Netherlands. This positive development is partly driven by
a temporary reduction in VAT on rebuilding, renovation
and repair, a measure now due to end on 1 July 2015.
Archi-vision predict a small increase in Netherlands
construction activity in 2014 (+1%), gradually
strengthening in 2015 (+2%) and 2016 (+3%).
In Belgium, the Archi-vision survey also indicates a
gradual improvement in construction sentiment and
activity since mid-2013. Belgian building permits are
rising slowly, mainly due to growth in the residential
sector. Archi-vision forecasts consistent 2% per annum
growth in Belgian construction during the period 2014 to
2016.
European wood joinery production continues to
decline
According to newly-published Eurostat data, the total
value of EU production of wooden doors and windows
declined in 2013. EU imports of both commodities fell
even more sharply. Domestic producers increased their
already hugely dominant position in these market
segments.
EU wooden door production was €5.79 billion in 2013,
down 2.1% compared to the previous year (Chart 7).
Wooden door production increased in all three of the
largest manufacturing countries: Germany (+2.6% to
€1110m), the UK (+6.9% to €840m) and Italy (+2.2% to
€780m).
However, this was offset by a sharp fall in production in
France (-7.3% to €640m) and Spain (-25.2% to €330m).
Production in Poland remained static at €380m.
EU wood window production fell 1.76% from €6.07
billion in 2012 to €5.96 in 2013 (Chart 8). The decline was
mainly due to a 3.2% fall in production in Italy, the largest
wood window manufacturing country, from €1340m in
2012 to €1300m in 2013.
Production in Denmark also continued a long-term
downward trend, falling a further 4.7% to €440m in 2013.
Production in Germany and France remained stable,
respectively €870m and €610m in both 2012 and 2013.
However, production increased in Poland (+7.1% to
€550m) and the UK (+14% to €450m) during 2013.
The downward trend in EU production of wood windows
and doors is partly the result of the decline in overall
construction activity. This has been particularly
pronounced in the new build sector with the result that
renovation and refurbishment activity is now a much more
important driver of demand.
Around 60% of all windows manufactured in Europe are
now utilized in the renovation sector and only 40% in the
new build sector.
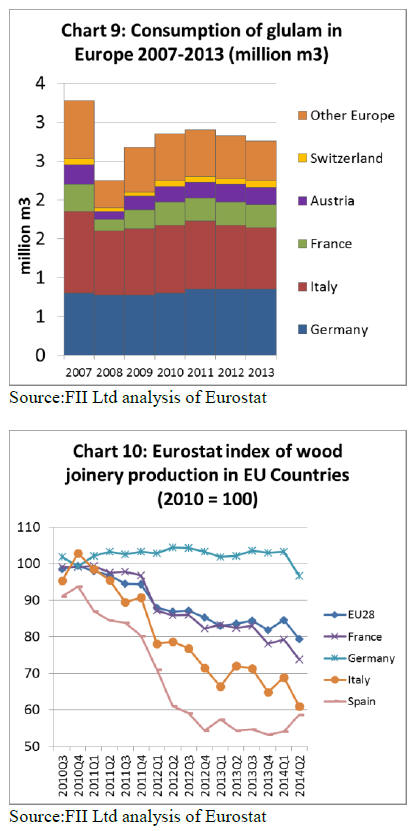
European production and consumption of glulam, used in
large dimensions for structural applications and smaller
dimensions for windows, also declined in 2013 (Chart 9).
Consumption declined 4% in Italy to 790,000 cu.m and
2% in Austria to 220,000 cu.m. However consumption
was stable in Germany and France in 2013 at around
830,000 cu.m and 300,000cu.m respectively.
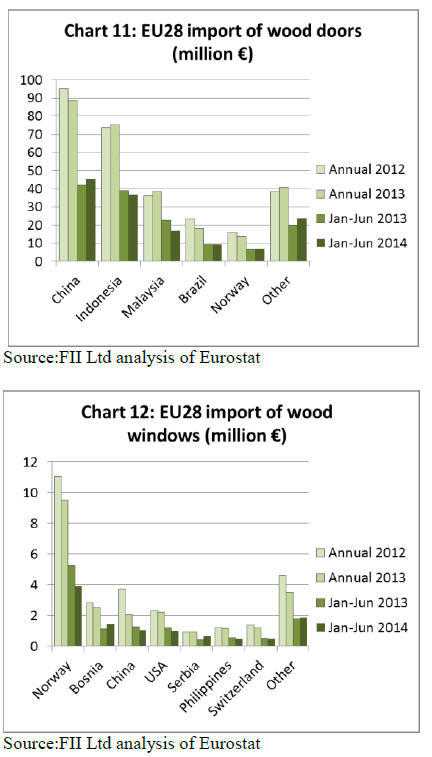
The Eurostat index of joinery production in EU countries
(which excludes flooring but includes doors, windows and
glulam) shows that production increased slightly in the
first quarter of 2014 but then fell away sharply in the
second quarter (Chart 10). An upturn in joinery production
in Spain and the UK in the second quarter of this year was
insufficient to offset a downturn in Germany, France and
Italy.
Energy efficiency helps drive joinery sector demand
In addition to underlying economic growth, future
development of the construction sector is heavily
dependent on legislation to improve energy efficiency of
the existing building stock in European countries. Various
new measures are expected to encourage more rapid
growth in the window and doors sector than in the overall
construction sector.
In December 2012, the EU published a new Energy
Efficiency Directive requiring Member States to
implement most of its provisions by 5 June 2014.
The Directive establishes a common framework of
measures for promotion of energy efficiency to ensure the
achievement of the EU‟s 2020 20% headline target on
energy efficiency and to pave the way for further energy
efficiency improvements beyond that date.
All EU-28 countries are now required to use energy more
efficiently at all stages of the energy chain �C from the
transformation of energy and its distribution to its final
consumption. Most countries have identified
improvements in existing building stock as one of the most
cost-effective ways to meet the Directive. They are
therefore introducing building regulations with tighter
energy efficiency requirements for windows and doors.
EU Member States are also obliged under the Directive to
renovate at least 3% of buildings owned and occupied by
the central governments starting from 1 January 2014.
They must also include energy efficiency considerations in
public procurement so as to purchase energy efficient
buildings and products.
Given wood‟s strong natural insulation qualities and recent
improvements in wood manufacturing technology, the
wood window and door sector is well placed to exploit
these new opportunities. However, competition is intense
and other material sectors are gearing up research and
development and marketing activities.
The wood industry in Europe faces a particularly strong
challenge from the PVC sector which accounts for at least
two thirds of the windows market in many EU Member
States. Aluminium windows also account for a
comparatively large share of the market, particularly in
Spain, Portugal and Italy, partly explained by relatively
low price for these windows.
A recent report by independent market analysts Ceresana
forecasts a consistent rise in demand for window and door
units across the EU until 2020 driven by a gradual
improvement in construction activity and a significant rise
in refurbishment. Solid wood windows are anticipated to
lose market share, both to PVC and to wood/aluminium
composite windows.
However, wood (mainly veneer and laminate doors) is
expected to continue to dominate the interior door market
and to maintain share (currently around one third) of the
external door market.
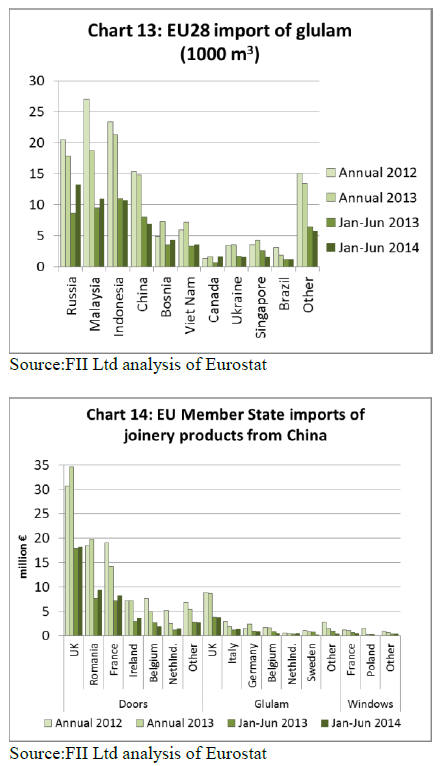
No change in EU imports of wood doors in 2014
Imports of wood doors into the EU were valued at €139m
in the first 6 months of 2014, exactly equivalent to the
same period the previous year (Chart 11). Imports from
China increased 7.6% to €45.6m, but these gains were
offset by declining imports from Indonesia (-5.8% to
€36.8m) and Malaysia (-25.6% to €16.8m). Imports of
wood doors from Brazil remained stable at €9.2m during
the period. Imports currently account for around 4.5% of
the total value of EU wooden door consumption, down
from 5% in 2010.
EU imports of wood windows continue to decline
The EU market for wood windows is very heavily
dominated by domestic producers. Imports currently
account for only 0.4% of the total value of EU wooden
window consumption, down from 0.8% in 2007. Most
wood windows imported into the EU derive from other
European countries, notably Norway and Bosnia.
In the first 6 months of 2014, imports fell from most of the
leading supply countries including Norway, China, the
USA, Philippines, and Switzerland. However there was a
slight increase in imports from Bosnia and Serbia (Chart
12).
Recovery in EU glulam imports in 2014
The EU imported 61,400 cu.m of glulam products in the
first half of 2014, 9% more than the same period in 2013.
Imports from Russia increased 54% to 13,300 cu.m in the
first six months of this year (Chart 13). As a result Russia
has overtaken Malaysia to become the largest external
supplier of glulam to the EU this year.
However there was also a 16% increase imports from
Malaysia to 11,000 cu.m this year. Meanwhile imports
declined 2% to 10,700 cu.m from Indonesia and 14% to
6,900 cu.m from China. Imports of glulam account for
around 5% of total EU consumption of this commodity.
Much of the imported glulam consists of dimension
product for window manufacturing. Glulam imports from
Russia and China are primarily pine and larch. Imports
from Malaysia and Indonesia consist of meranti.
EU28 imports of joinery products (excluding flooring)
from China had a value of €54.5 million in the first 6
months of 2014, 3% more than the same period the
previous year. This partially reverses the 9% decrease (to
€108m) in EU28 imports of Chinese joinery products
between 2012 and 2013.
Chart 14 summarises EU imports of joinery products from
China by product group and EU Member State. Doors
make up the bulk of EU joinery trade with China, with
total value of €88.5 million in 2013. The EU and Romania
are the main European markets for China‟s wooden doors
and both countries have been importing rising quantities
over the last 2 years.
Imports of Chinese wooden doors by France, the third
largest market, declined between 2012 and 2013, but have
increased again this year.
The UK is the only EU country importing significant
quantities of glulam products from China, with value of
around €8.7 million in both 2012 and 2013. UK imports of
Chinese glulam products were €3.8 million in the first 6
months of 2014, 1.6% less than the same period in 2013.
EU imports of finished wood windows from China are
negligible and declining. EU imports of this commodity
fell from €3.7 million in 2012 to €2.1 million in 2013. In
the first half of 2013, EU imports of Chinese wood
windows were only €1 million, mainly destined for France
and Poland.
|