Japan
Wood Products Prices
Dollar Exchange Rates of 25th
February 2017
Japan Yen 112.14
Reports From Japan
Workers told ¨CLeave work at 3pm and spend
money
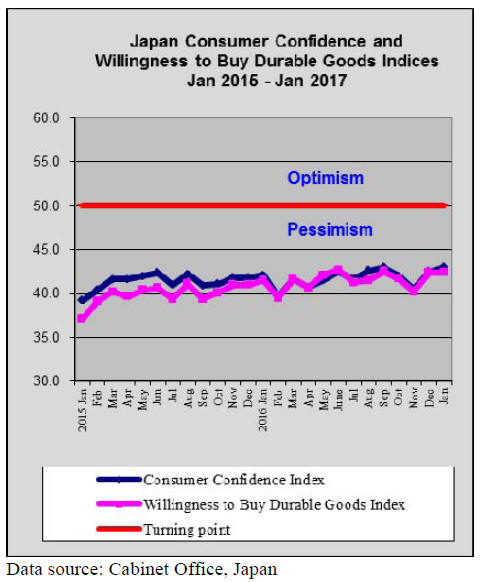
The Cabinet Office has downgraded its assessment of
consumer spending marking the first downgrade in almost
a year. Across Japan, households have been hit with higher
food prices and have become increasingly skeptical about
the prospects for the economy and wage growth. Put
together, this has resulted in households cutting back on
non-essential purchases such as household goods and
furniture.
The increasingly cautious view of consumer, if it
continues, will be a source of concern for policymakers
who are struggling to fight deflationary trends.
On the last Friday of each month, beginning 24 February,
companies across Japan were encouraged to send workers
home by 3pm. The object of this strategy is to let workers
get an early start to the weekend and begin spending by
eating out or taking advantage of special discounts offered
for late Friday flights and train journeys.
This so-called ˇ®Premium FridayˇŻ campaign has been
launched by the government and is supported by the
business community. In a country notorious for its culture
of long working hours this is a drastic change.
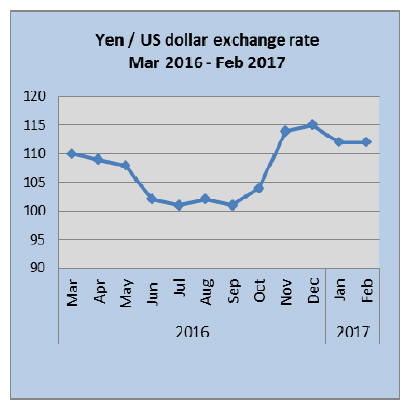
Weak Yen boosts exports but raises cost of
imports
A weaker yen drove exports and business sentiment higher
in the final quarter of 2016 which resulted in an
annualized 1% growth of the overall economy.
However, with consumption remaining subdued, the
prospects for early 2017 are subject to external influences
more than a stronger internal demand which the
government seeks.
In March the annual wage negotiations between unions
and management begin and early signs are that pay rises
will be similar to last yearˇŻs which will do nothing to boost
consumption.
This means the best hope for the economy is a weak yen
however the new US administration seems set to follow up
on its assertion that Japan is a currency manipulator which
could mean the yen will strengthen against the US dollar.
This would undermine JapanˇŻs export growth.
While a weak yen is good for exporters it is bad for
household spending and the prospects are rising for a clash
between the Bank of Japan, which supports a weak yen,
and the government that is trying to spur household
spending. In addition, any further yen weakness would
raise tensions between Japan and the US.
Apartment building boom in Tokyo coming to an end
The number of unsold new apartments in Tokyo has
reached a five year high which suggests TokyoˇŻs
apartment building boom is nearing its end.
Much of the energy in the Tokyo market for apartments
came from Chinese buyers but, with a crackdown on
Chinese citizens moving money offshore, the steam has
gone out of the market.
As the stock of empty apartments rise rents are
falling and
prices, especially for apartments near the Olympic Games
venues, have started to fall.
Data from the Real Estate Economic Research Institute of
Japan reports that the average price of a newly-built threebedroom
apartment in Tokyo rose 24% in January last
year the highest on pace record .
JapanˇŻs wooden furniture imports
JapanˇŻs 2016 wooden furniture imports (HS 940330,40
and 50) fell around 3% in yen terms against levels in 2015.
Overall, wooden office furniture imports were down 6%
year on year, wooden kitchen furniture imports dropped
around 4% year on year and bedroom furniture imports
also fell but by a smaller margin (-2.3%).
While there is no clear cyclical trend in imports of either
office or kitchen furniture, imports of bedroom furniture in
2015 and again in 2016 show a distinct cyclical trend.
In both years in the first half of the year imports drifted
down only to begin climbing again in the second half of
the year.
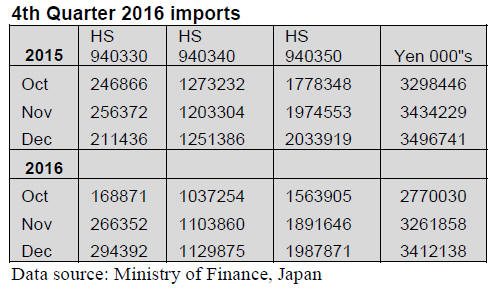
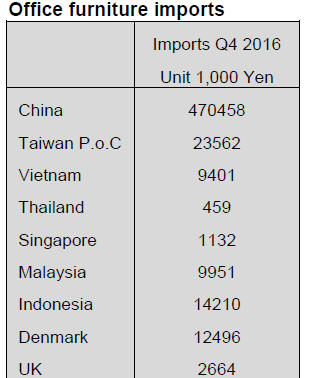
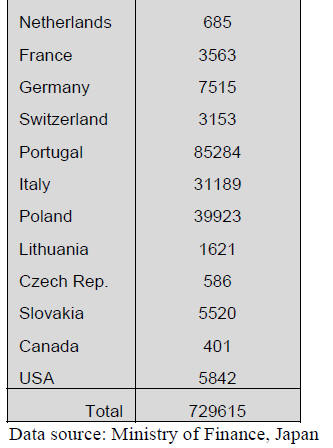
4th Quarter 2016 office furniture imports (HS
940330)
China, Portugal and Poland, in order of rank, were the top
suppliers of wooden office furniture to Japan in the final
quarter of 2016.
Together these three shippers accounted for over 80% of
JapanˇŻs wooden office furniture imports in the last quarter
2016.
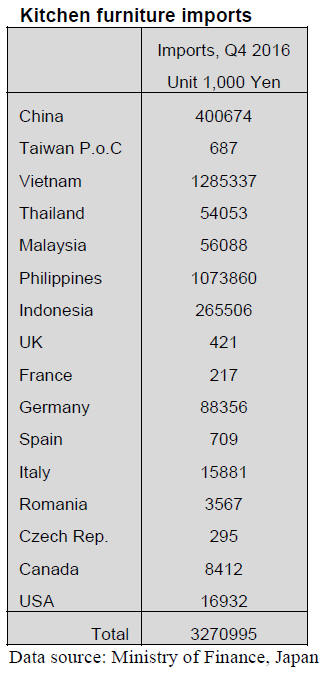
4th Quarter 2016 kitchen furniture imports (HS
940340)
Year on year, JapanˇŻs 2016 imports of wooden kitchen
furniture were down 4% and in the final quarter of 2016
fell by the same amount compared to the same period in
2015.
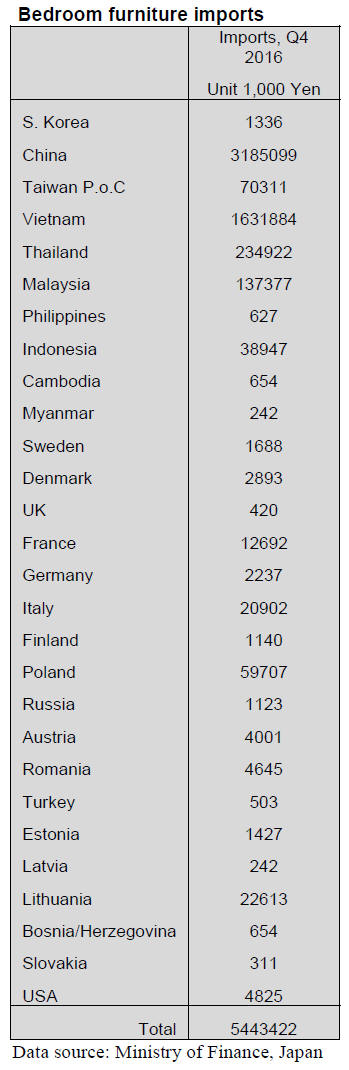
4th Quarter 2016 bedroom furniture imports
(HS 940350)
Just two suppliers, China (59%) and Vietnam (30%)
accounted for almost 90% of JapanˇŻs imports of wooden
bedroom furniture in the fourth quarter of 2016. This
mirrors the trade throughout the year with the two largest
shippers dominating imports.
The third ranked supplier in the fourth quarter 2016
was
Thailand which contributed a modest 4% to total fourth
quarter imports of this product.
Trade news from the Japan Lumber Reports (JLR)
For the JLR report please see:
http://www.nmokuzai.
com/modules/general/index.php?id=7
Plywood supply in 2016
Total plywood supply in 2016 was 5,834,200 cubic
meters, 3.1% more than 2015. In this, domestic supply was
3,063,500 cbms, 10.6% more than 2015. This is first time
to reach three million cbms after nine years since 2007.
Imported plywood was 2,770,600 cbms, 4.0% less than
2015. This is two straight years decline under three million
cbms. Share of domestic and imports reversed with 47.5%
of imports and 52.5% of domestic supply. This is the first
reversal of share in 21 years.
In 2016, domestic supply increased by about 10% then the
imports continued to decline so the total was almost
unchanged from 2015. In 2016, the yenˇŻs appreciation
sharply progressed in early year then in late 2016, the yen
depreciated so the price increase of imported plywood was
necessary so the importers and wholesales had hard time
all through the year.
Despite slow movement of imported plywood, it is
noticeable fact that monthly average of 238,800 cbms of
imported plywood continued through the year. This tells
there is firm demand for imported plywood even when the
demand is shifting to domestic plywood, wooden board
and non-wood materials.
In domestic production, softwood production was
2,897,200 cbms, 11.9% more than 2015. Structural
softwood plywood production was 2,786,500 cbms, 17.7%
more, which is more than total imported plywood supply.
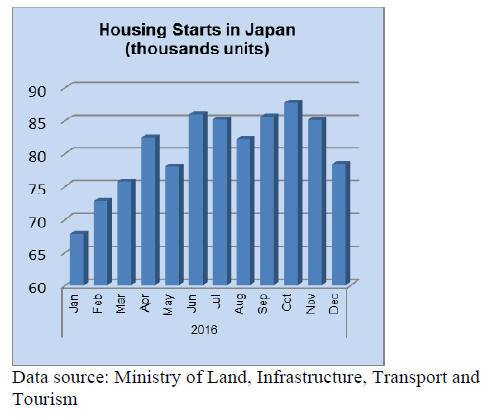
The demand for softwood plywood had been very active
all through the year by strong housing starts so the
shipment of soft wood plywood was 2,939,000 cbms,
9.1% more than 2015.
The inventory peaked in March with 128,400 cbms then it
had been declining month after month and the December
inventory was only 82,500 cbms.
In imported plywood, Malaysian supply was 1,075,500
ccbms, 10.3% less than 2015. Indonesian supply was
903,300 cbms, 5.2% more, which was supported active
demand for floor base. Chinese supply was 616,600 cbms,
5.0% less.
JapanˇŻs log export in 2016
According to the trade statistics of the Ministry of
Finance, total log export in 2016 was 644,257 cubic
meters, 6.1% less than 2015. Kyushu took 79.6% share of
log export. Total value was 7,735 billion yen, 15.1% less.
In 2016, log exporters had hard time with strong yen and
slow down of Chinese economy but they tries to maintain
the business by performing the contracts despite negative
factors. KyushuˇŻs export volume was 513,089 cbms, 2.8%
less than 2015. Export business increased some in the first
half then it decreased in the second half.
Total value of log export in Kyushu was 5,980 billion
yen, 12.7% less. After the second half of last year, the yen
weakened then there are increasing inquiries from China
and number of log exporter increased so that export log
prices in Kyushu are climbing.
By port, Shibushi, the largest export port previous year,
exported 199,323 cbms and maintained the top export port
in 2016.Sendai exported 31,772 cbms so total volume
from Kagoshima prefecture increased some from 2015.
Other ports are Hososhima with 63,436 cbms, Minamata
with 36,141 cbms, Sakai with 11,396 cbms, Shimizu with
12,710 cbms, Kanda with 4,993 cbms, Yokkaichi with
4,982 cbms.
By species, cedar was heavy from Shibushi, Hososhima,
Yatsushiro and Saheki, all Kyushu ports. Cypress was
main from Yatsushiro, Imari and Minamata, all Kyushu
ports. Other softwood log export ports are Hakodate and
Rumoi, all Hokkaido ports, which shipped species like
larch.
Meantime, total lumber export in 2016 was 83,700 cbms,
47% more than 2015. Lumber volume for Korea is flat but
for China, it increased considerably. Main shipping ports
are Tokyo with 25,535 cbms, Hakata with 10,411 cbms,
Matsuyama with 4,427 cbms, Nagoya with 5,636 cbms,
Moji with 2,958 cbms, Kouchi with 2,750 cbms,
Hiroshima with 2,548 cbms, Mizushima with 2,504 cbms
and Hososhima with 2,119 cbms. By species Kyushu ports
shipped mainly cedar and Shikoku and Chuugoku ports
shipped mainly cypress
South Sea (Tropical) logs
Both Sarawak and Sabah, Malaysia are in rainy season and
rain continues day after day. While some coastal part of
Sabah has improved weather. Sarawak suffers heavy rain
everywhere. Together with severe control of illegal
harvest, Sarawak log production is very low. Therefore
export log suppliers remain very bullish.
Japanese log importers are indecisive for future log
purchase due to unstable exchange rate fluctuation.
In PNG and Solomon Islands, there has been talks of
higher log export duty but so far there is no official
increase by strong opposition by log exporters. If the duty
increases materialize, log prices would be up and supply
volume may change.
In Japan Sea side ports in Japan, cleaning and renovation
of lock gate are done in every two years and it is being
done now and the gate will be closed until end of February
or March.
Plywood mills in Niigata have procured enough logs until
April. Some South Sea hardwood plywood
mills in Japan reduce their own production then buy
plywood from South Sea countries as consignment
and maintain the same amount of sales of plywood. With
tight supply of logs in Malaysia and decreasing
plywood production in Japan, log purchase by Japan will
further decline.
Present export log prices of Sarawak meranti are US$276-
278 per cbm FOB on regular, US$255-260 on meranti
small and US$240-245 on super small.
European lumber import in 2016
Total import of European softwood lumber in 2016 was
2,736,628 cbms, 14.8% more than 2015 and this was the
highest since 2013. Supply of stud and lamina increased
by active housing starts of wooden units and structural
laminated lumber. In particular, increase of lamina is
noticeable, which supply had been tight all through the
year.
The European suppliersˇŻ aggressive production for
Japan,
stimulated by higher export prices by strong yen,
contributed increased import. Stud, taruki and 2x4
lumber, which are planed processed products are 936,528
cbms, 7.7% more. Semi ¨Cfinished products like lamina and
genban are 1,800,100 cbms, 18.9% more.
By source, Finland, which is the main source of lamina,
was 941,468 cbms, 13.2% more. Sweden was 767,584
cbms, 19.9%. These two countries exported more than
1,700,000 cbms, which took 62.5% share in total
European lumber.
Finland volume increased by newly built Keitele group
mill so not only semi-finished lamina and genban but
finished products like stud increased. Austria, where Stora
Enso has sawmills, shipped 354,432 cbm, 13.3% more
while Rumania, where Schweighofer has sawmills,
decreased to 238,835 cbms, 11.1% less.
Germany, where Schweighofer newly acquired sawmills,
shipped 133,326 cbms, 117.5% more. Czech was 107,312
cbms, 4.5% less. Latvia was 131,194 cbms, 20.1% more.
Estonia was 48,196 cbms, 30.8% more.
Supply of stud was unstable due to tight supply of quality
logs in the first half of the year then with higher export
prices stimulated supply in the second half of the year.
North American log import in 2016
North American log import in 2016 was 2,790, 662 cbms,
8.8% more than 2015. This is the first increase after three
years. U.S.A. increased 2.7% and Canada also increased
by 22.2%. Douglas fir logs increased by about 30% due to
recovery of plywood demand and strong demand for
lumber.
However, both did not make 2014 level and total was
under 3 million cbms for two straight years.
By species, Douglas fir was 2,542,547 cbms, 9.8% more
than 2015. Hemlock was 155,265 cbms, 20.5% more.
Spruce was 41,448 cbms, 31.1% less. Yellow cedar
(cypress) was 12,162 cbms, 11.4% less. Red cedar was
5,533 cbms, 42.4% less. White fir was 36 cbms, 91.5%
less. Hardwood was 33,671 cbms, 3.1% less.
Both Douglas fir and hemlock increased but others are all
down. Douglas fir sawmills increased the production in an
anticipation of rush-in demand before consumption tax
hike then plywood mills, which reduced the production in
2015, made a full operation in 2016 by active demand so
both contributed to increase Douglas fir volume.
Volume from the U.S.A. was 1,733,391 cbms, 2.4% more
then volume from Canada was 809,156 cbms, 29.9%
more. Market of Canadian Douglas fir was mainly
plywood then since 2016, Chugoku Lumber, the largest
Douglas fir lumber manufacturer in Japan, started
purchasing Canadian Douglas fir so this contributed
increase of Canadian Douglas fir log import.
Despite increase of Canadian logs, U.S.A. remains
dominant supply of Douglas fir logs. If Canada puts up
more logs for export, Japan would be buying more
Douglas fir logs from Canada.
Hemlock volume from Canada was 149,168 cbms, 19.6%
more while that from the U.S.A was 6,097 cbms, 47.4%
more. Spruce from Canada was 11,804 cbms, 69.4% less
and from the U.S.A was 29,644 cbms, 37.5% more.Yellow
cedar volume from Canada was 7,632 cbms, 20.8% less
and from the U.S.A. was 4,530 cbms. 10.9 % more. Red
cedar from Canada was 2,251 cbms, 68.0% less and from
the U.S. A. was 3,282 cbms, 28.3% more.
North American lumber import in 2016
Imported lumber volume in 2016 was 2,235,652 cbms,
4.4% less than 2015. This is three consecutive yearsˇŻ
decline. New wooden housing starts were 8.3% more than
2015 but the market share of North American lumber
dropped by supply expansion of competing materials. Also
supply decrease for Japan market by active North
American lumber market. Particularly Douglas fir lumber,
which is used for traditional type housing in Japan,
dropped by 11.6%. Compared to recent peak of 2013, it is
34.2% drop.
By species, SPF was 1,347,236 cbms, 0.2% less than
2015. Douglas fir was 419,133 cbms, 11.6% less.
Hemlock was 293,897 cbms, 1.5% less. Yellow cedar was
68,490 cbms, 17.2% less. Sitka spruce was 11,524 cbms,
29.8% less.Hardwood was 50,914 cbms, 16.8% less so all
the species decreased from 2015.
2x4 SPF lumber has no other substitution so it should
increase as 2x4 housing starts increases, which was 7.9%
more but in the first half of the year, the housing demand
was slower then in the second half, supply got tighter so
Japan could not purchase enough volume.
Softwood lumber agreement between U.S. and Canada,
which imposed 15 % duty on export lumber from Canada,
expired on October 2016 so the lumber shipment from
Canada to the U.S. increased.
Douglas fir lumber had to compete with European lumber,
domestic lumber and Douglas fir lumber manufactured by
domestic sawmills. By source, Canada was 217,500 cbms,
7.3% less and the U.S.A. was 201,633 cbms, 15.7% less.
Hemlock did not drop so much but compared to 2014, it is
13.2% less. In the second half of the year, hemlock supply
was ample. Yellow cedar and red cedar were largely
affected active shipment for the U.S. market and resultant
higher prices.
|