|
Report from
Europe
EU wood furniture production sliding even before
pandemic
Newly released Eurostat data indicates that the value of
EU27+UK wood furniture production was €42.5 billion in
2019, 1.4% less than the previous year.
In retrospect, it looks as if the rebound in EU wood
furniture production following the 2008 economic crises
peaked as early as 2017, as 2019 was the second straight
year of decline and the COVID-19 pandemic has damaged
market prospects in 2020. Last year, EU wood furniture
production was still 20% down, in real terms adjusted for
inflation, compared to the years just prior to the 2008
crises.
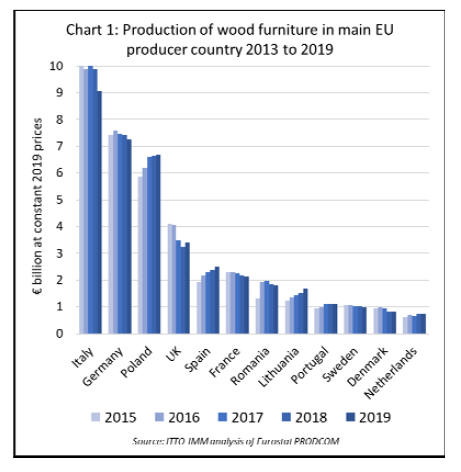
Last year, there was a sharp downturn in wood furniture
production in Italy (-8% to €9.1 billion), and a more
moderate decline in Germany (-3% to €7.2 billion), France
(-2% to €2.1 billion), Romania (-3% to €1.8 billion), and
Sweden (-1% to €1.0 billion). These declines were only
partly offset by rising production in Poland (+1% to €6.7
billion), UK (+5% to €3.4 billion), Spain (+4% to €2.5
billion), Lithuania (+10% to €1.7 billion), Denmark (+2%
to €0.8 billion) and the Netherlands (+1% to €0.7 billion).
Production was stable in Portugal during the year, at €1.1
billion. (Chart 1).
European wood furniture manufacturers lost internal EU
market share to overseas producers in 2019, although they
remained very dominant overall. In 2019, 86.4% of all
wood furniture sales in the EU27+UK market comprised
products manufactured within the EU27+UK, a marginally
lower percentage than the previous year (87.6%).
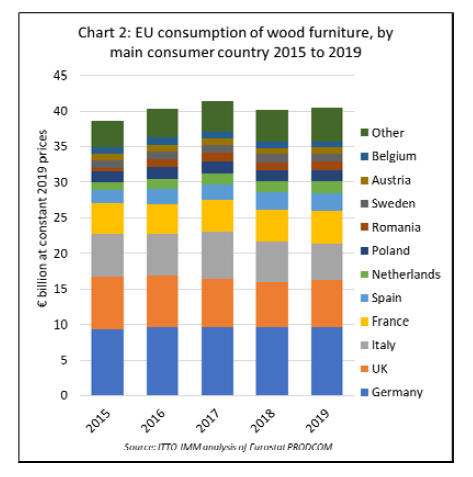
EU27+UK wood furniture consumption was €40.4 billion
in 2019, a gain of 0.6% compared to 2018. In 2019,
consumption increased in the UK (+6% to €6.7 billion),
France (+2% to €4.5 billion), Spain (+8% to €2.6 billion),
Netherlands (+8% to €1.7 billion), Romania (+3% to €1.2
billion), Austria (+7% to €0.9 billion), and Belgium (+2%
to €0.9 billion). However, consumption fell 11% to €5.2
billion in Sweden, 3% to €1.5 billion in Poland, and 7% to
€1.0 billion in Sweden. (Chart 2).
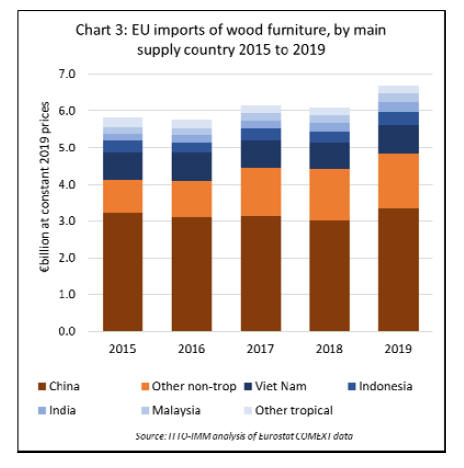
Uptick in EU27+UK wood furniture imports in 2019
EU27+UK imports of wood furniture from non-EU
countries increased nearly 10% to €6.7 billion in 2019
after falling 1% in 2018. Imports from China, by far the
largest external supplier, increased 11% to €3.34 billion in
2019, while imports from other non-tropical countries
increased 7% to €1.50 billion.
Imports from tropical countries increased 11% overall to
€1.87 billion. (Chart 3).
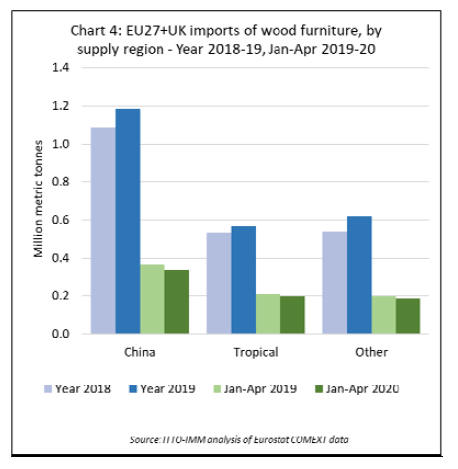
Total EU27+UK import tonnage increased 10% in 2019,
to 2.37 million metric tonnes (MT). Import tonnage
increased by 9% from China to 1.18 million MT, by 15%
from other non-tropical countries to 620,000 tonnes, and
by 6% from tropical countries to 570,000 MT (Chart 4).
Continuing the trend of recent years, in 2019 there was a
particularly large increase in import tonnage of wood
furniture from several countries bordering the EU,
including Ukraine (+32% to 104,000 MT), Belarus (+32%
to 95,000 MT), Turkey (+20% to 95,000 MT), and Serbia
(+13% to 60,000 MT).
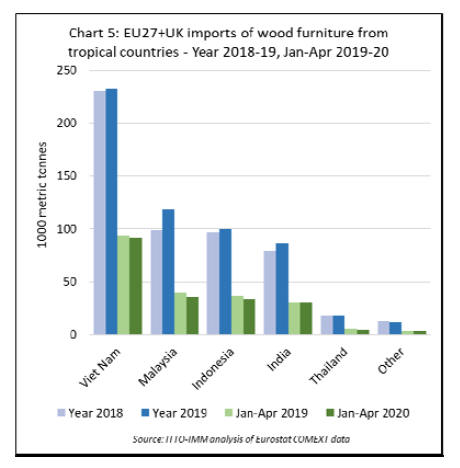
Vietnam was by far the largest tropical supplier of wood
furniture to the EU27+UK in 2019, with imports from the
country rising 1% to 232,000 MT. However, the largest
gain by a tropical country in the EU wood furniture import
tonnage in 2020, was by Malaysia with a rise of 20% to
119,000 MT.
There was also a 9% rise in import tonnage from India, to
30,000 tonnes. Import tonnage from Indonesia increased
3% to 100,000 MT in 2019. Import tonnage from Thailand
was stable at 18,000 MT in 2019. (Chart 5).
First indications of post-lockdown rebound in EU wood
furniture imports
The development of the EU27+UK wood furniture market
this year will be strongly dependent on the effects of the
COVID-19 pandemic, as it is having a profound impact on
both supply and demand. Data indicating the likely scale
and duration of these impacts is only just becoming
available and is still fragmentary.
Import data for the whole of the EU27+UK region is
currently available to the end of April 2020 and captures
only the earliest stages of the lockdown which began in
mid-March in most European countries.
Given lead times typically of five weeks or longer to
deliver Asian furniture to the European market, this data
provides only limited insight into the effects of the
pandemic.
In total, the EU27+UK imported 720,000 tonnes of wood
furniture in the first four months of this year, 8% less than
the same period in 2019. Imports fell by 10% from China,
to 330,000 MT, by 7% from other non-tropical countries,
to 180,000 MT, and by 6% from tropical countries, to
200,000 MT (Chart 4).
The biggest decline in EU27+UK imports of wood
furniture from tropical countries in the first 4 months of
2020 was from Malaysia, down 12% to 35,000 MT.
Imports also declined sharply from Indonesia, by 9% to
34,000 MT, and Thailand, by 25% to 4,400 MT. Imports
were down only 2% to 92,000 tonnes from Vietnam.
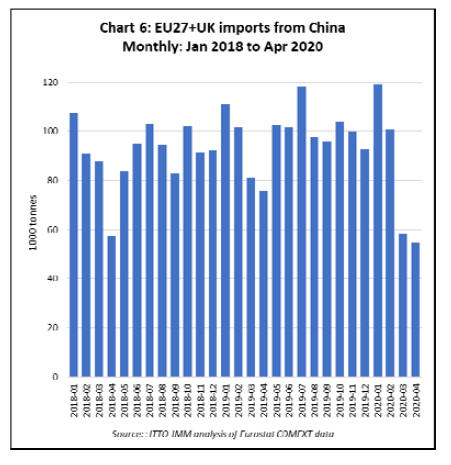
Closer analysis of monthly import and export data gives
more insight into the effects of the pandemic and the pace
of the rebound. The available data on EU27+UK imports
of wood furniture from China shows a very sharp dip in
March and April this year (Chart 6).
This is partly cyclical since EU27+UK imports from
China tend to decline in the spring months after a rush at
the turn of the year to despatch products before the
Chinese New Year holiday season.
However, the dip in EU arrivals this year started early in
March, due to supply side problems in China, and
deepened into April.
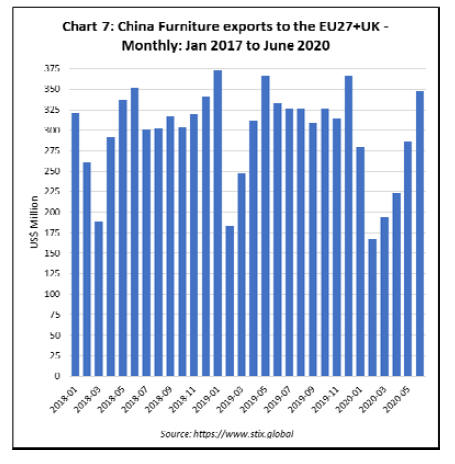
The supply side problems in China early in 2020 are more
obvious from export data (Chart 7). ChinaˇŻs exports of
wood furniture to the EU27+UK fell more steeply than
usual in February this year and remained at unusually low
levels in March and April. However, there was a strong
recovery in ChinaˇŻs exports to the EU27+UK in May and
June, strongly suggesting that the direct effects of the
COVID-19 lockdown on EU27+UK imports of wood
furniture from China will be short lived.
Signs of the market impact of COVID-19 are also
becoming clearer for tropical suppliers. EU27+UK imports
of wood furniture from Vietnam were strengthening in
April (Chart 8).
However, this is certain to be followed by a significant
decline in May through to July. Again, this is indicated
both by cyclical changes ¨C EU27+UK imports of wood
furniture from Vietnam typically fall in the second quarter
of the year - and by Vietnamese export data.
Latest data from www.goviet.org.vn shows that the total
value of all Vietnamese wood and wood products exports
to the EU27+UK ¨C which is dominated by wood furniture
- fell 41% from US$213.7 billion in the first quarter to
US$125.6 million in the second quarter.
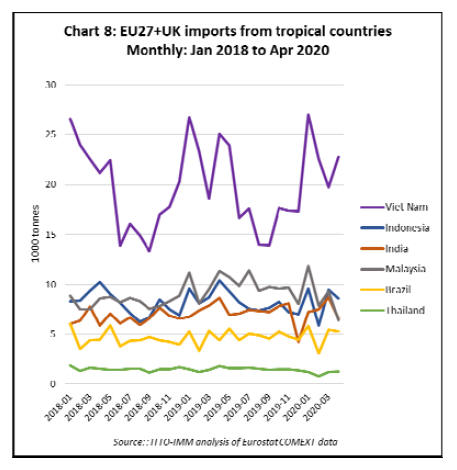
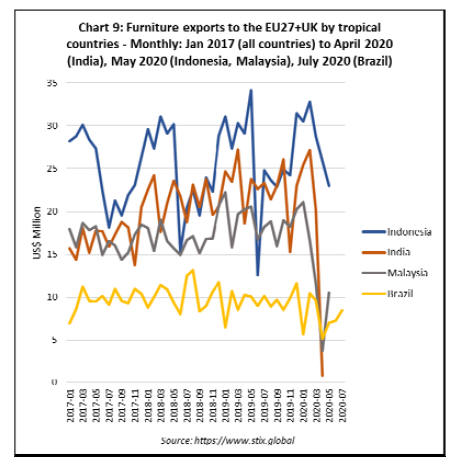
EU27+UK imports from Indonesia were quite strong in
the first quarter of 2020 and weakened only slightly in
April. Export data reveals a downturn in Indonesian
despatches to the EU27+UK in April and May this year,
but not out of line with trends in previous years (Chart 9).
IndonesiaˇŻs furniture exports to the EU are dominated by
outdoor products, particularly due to relatively abundant
plantation teak supplies. It maybe that Indonesia is
benefitting from the continuing relative strength of
European demand for outdoor furniture during lockdown.
Social distancing measures meant more people meeting
outside and restaurants and bars only serving to customers
outside. A run of good weather has also encouraged
people confined to their homes to install garden decking
and sheds.
The impact of the COVID-19 pandemic on EU27+UK
imports of wood furniture from India, which mainly
supplies a niche market for handcrafted interior furniture,
appears to have been much more severe.
Export data indicates an extremely sharp (96%) fall in
IndiaˇŻs exports of wood furniture to the EU27+UK in
April this year ¨C a trend confirmed by import data for
those few European countries that have already published
trade statistics to the end of May, including the UK,
France and Spain.
Malaysian trade data shows a severe decline in wood
furniture exports to the EU27+UK between January and
April this year, but trade began to rebound and make up
some ground in May.
The Eurostat furniture production index for EU countries
is another indicator of the scale of the downturn and rate
of recovery in the European furniture sector during
lockdown period (Chart 10).
For most EU countries, the monthly index was broadly
stable throughout the whole period from January 2015
through to February 2020 ¨C the only exceptions being
Poland and Lithuania, both of which outperformed all
other EU countries by recording a significant rise in
production.
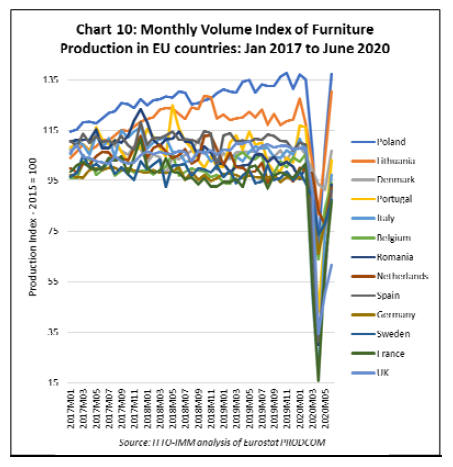
The picture changes dramatically in March, with nearly all
leading EU furniture manufacturing countries recording a
precipitous and unprecedented fall in production as the
continent went into the lockdown.
The downturn deepened in April but was followed by
recovery in May and June for all countries. While the
overall trend was the same, the depth of decline and rate of
recovery varied widely between countries (Chart 11).
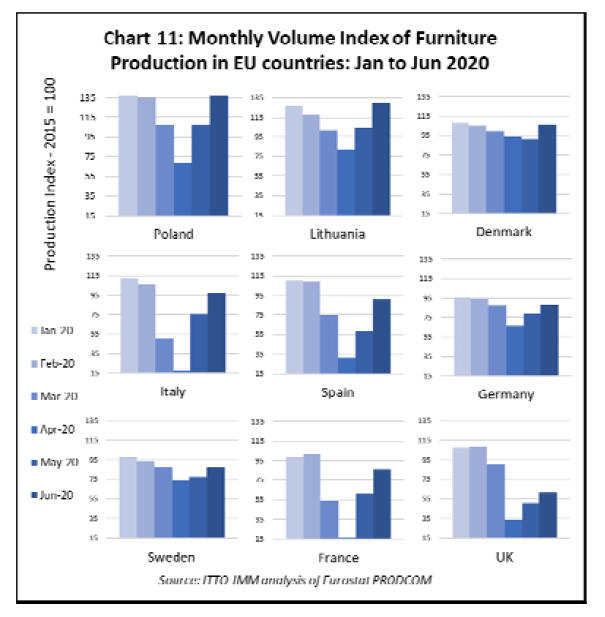
Compared to other EU countries, Germany, Sweden and
Denmark all suffered less dramatic declines in production
in April and March and production was close to normal
levels by June. In Poland and Lithuania the furniture
production index fell steeply in March and April, to
around 50% of previous (quite buoyant) levels, and then
recovered very strongly in May and June.
In Italy, Spain and France, there was a very large fall in
production in March and April ¨C down 85% on normal
levels in the case of France and Italy. Although still down
20% on normal levels in June, the rebound In France, Italy
and Spain was quite robust. In the UK, the decline in
March and April was large, down 65% on usual
production levels, and the recovery slower and weaker
than elsewhere in Europe. In June UK production was still
down by around 50%.
|