|
Report from
North America
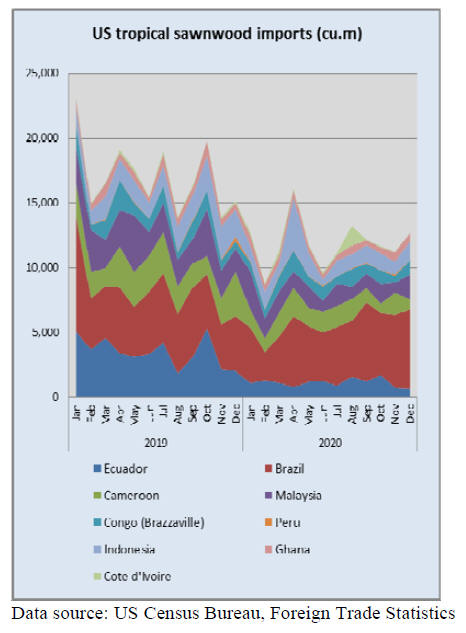
US tropical sawnwood imports plunge
The volume of sawn tropical hardwood imported by the
US fell by 34% in 2020 from 243,884 cubic metre in 2019
to 161,179 cubic metre in 2020. Imports rose 15% in
December to 14,687 cubic metre, the highest level since
August, but still 20% lower than the previous December.
Imports from all countries for the year were down
significantly with the exception of Cote dˇŻIvoire where
imports were up 69%. Imports from Brazil were off only
5% in 2020 while imports from Ecuador fell by 68% and
imports from Cameroon and Malaysia were both off by
more than 40%.
The US imported only half as much keruing in 2020 as in
2019, while teak imports fell by 57% and balsa imports
dropped 67%. Despite falling 26% for the year, jatoba
was the hardwood most imported by the US, while ipe was
a close second after gaining 4% over 2019.
December imports from Malaysia were up 145% to
surpass imports from the previous December by 5% after
lagging badly most months. Imports from Congo
(Brazzaville) also more than doubled in December. In
contrast, imports from Cameroon fell by 52% in
December.
Canada also imported significantly less sawn tropical
hardwood in 2020. Imports were down 17% overall with
imports from its two largest sources, the US and
Cameroon, falling 40% and 25% respectively. CanadaˇŻs
imports for the year of nearly all types of tropical
hardwood fell by at least 10%. Mahogany was the
exception, rising by 3%.
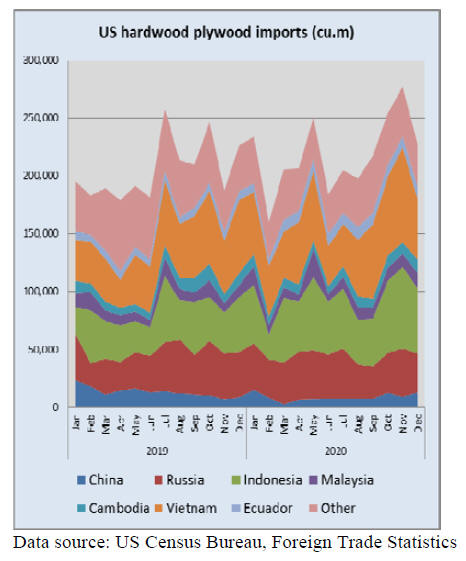
Hardwood plywood imports rose in 2020
Despite an 18% drop in December, US imports of
hardwood plywood ended 2020 up 6% in volume over the
previous year. Imports from China were down 35% in
2020 while imports from Indonesia and Ecuador both
increased by 36%.
Imports from Vietnam gained 17% for the year. Imports
from Russia and Cambodia in 2020 both held close to the
totals for 2019.
A decrease of 36% in imports from Vietnam in December
accounted for much of the monthˇŻs downturn, while
imports from Russia and Indonesia slid as well. Despite
the decrease from November numbers, December imports
were slightly better than those of the previous December.
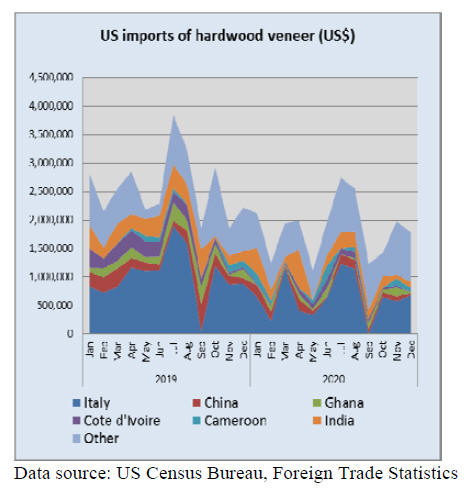
Veneer imports fall sharply in 2020
US imports of tropical hardwood veneer fell by 10% in
December and ended the year down 28%. For the year,
imports from Italy declined by 37%, imports from Cote
dˇŻIvoire were down 68%, imports from China were off by
49% and imports from Ghana fell 59%. The only source
country that saw gains in 2020 was Cameroon where
imports to the US rose by 51%.
December imports from India and Italy rose sharply,
however they were both still far below the levels of the
previous December.
Hardwood flooring imports fell in 2020 while
assembled flooring panel imports rose
US imports of hardwood flooring declined by 21% in 2020
as imports from Asian suppliers fell sharply. Imports from
China and Malaysia were both down 53% for the year
while imports from Indonesia fell by 34%.
Imports from the largest supplier to the US, Brazil, were
down only 4% for the year. December saw a healthy rise
in imports from Malaysia, climbing to its highest level of
the year.
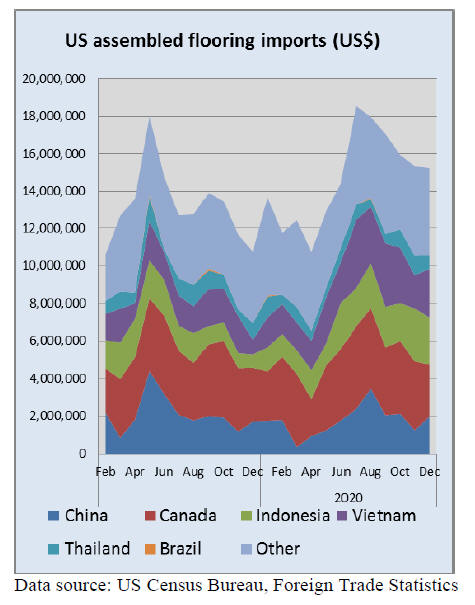
In contrast, US imports of assembled flooring panels
ended 2020 up 11% over the previous year. Imports from
Vietnam rose by 48% while imports from Indonesia
gained 28% in 2020. Imports from China fell by 18%,
while imports from Canada increased by 4%. December
imports were relatively flat, falling 1% for the month.
Moulding imports fell in 2020
US imports of hardwood mouldings closed 2020 down
13% from the previous year as imports from Brazil fell by
nearly half. Imports from Brazil were off by 47% in 2020
while imports from China were down 28% and imports
from Malaysia were down 20%. Imports from Canada
managed a 2% gain for the year.
December numbers were down 16% as imports from all
major trading partners fell. However, despite the decline,
December imports held at 1% higher than the previous
December.

Wooden furniture imports continue to rise
US imports of wooden furniture grew for the seventh
straight month in December and ended 2020
outperforming 2019 despite being behind for most of the
year. Imports for 2020 were over US$18.9 billion,
surpassing 2019 import values by 2%.
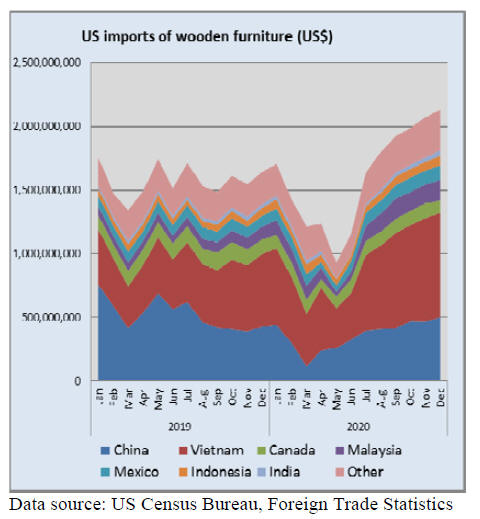
While imports from China were down by 31% for the year
by value, imports from Vietnam (up 32%) made up the
difference. Imports from Malaysia and Indonesia also
showed significant growth in 2020 as well as solid gains in
December.
The overall residential furniture market also continues to
grow. However, according to the Smith Leonard Furniture
Insights report, the increase in new orders has slowed.
While new orders were up 17% in November compared to
November 2019, increases were 51% in August, 43% in
September and 40% in October.
Year to date, new orders remained up 14% over the first
11 months of 2019 after the significant declines as the
pandemic took effect.
Cabinet sales end 2020 up after strong December
A press release from the Kichen Cabinet manufacturers
Association says US cabinet sales rose 11.6% in
December 2020 compared to the previous year's figures,
ending the year with six straight months of year-over-year
growth for the industry. According to participating
members in the Kitchen Cabinet Manufacturers
Association's monthly Trend of Business Survey, custom
sales were up 19.3%, semi-custom increased 12.5% and
stock sales increased 9.6% in December compared to the
same period in 2019.
When looking at the month-to-month comparison, cabinet
sales held fairly steady, the KCMA reported. Overall sales
were down 0.2% in December 2020 compared to
November. Custom sales increased 1.8%, semi-custom
sales decreased 2.2% and stock sales increased 0.7%.
For the year, 2020 cabinet sales were up 2%. Custom sales
increased 0.4%, semi-custom sales decreased 1.9% while
stock sales increased 5.1%.
See:
https://www.kcma.org/news/pressreleases/december_2020_trend_of_busines_press_release
|