|
Report from
North America
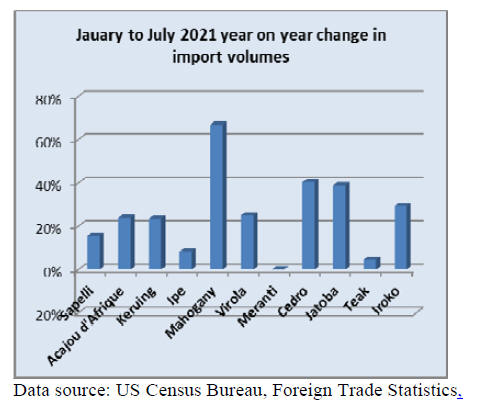
Tropical hardwood imports soar in July
Imports of sawn tropical hardwood rose 57% in July,
soaring to the highest volume of 2021. A surge in keruing
imports for the month led to the rise as keruing accounted
for more than 40% of the 12,207 cubic metres imported in
July. The 5,425 cubic metres of keruing imported in July
was up 404% over June and was the first time in the last
10 years the U.S. had imported more than 4,000 cubic
metres of keruing in a single month.
July also saw significant gains in imports of acajou
dˇŻAfrique (up 82%), mahogany (up 67%), and meranti (up
45%). Malaysia appears to be the source of the keruing as
imports from Malaysia hit a 10-year high, rising 344% for
the month to a level more than 3 times that of the previous
July.
The record month pushed year-to-date totals for imports
from Malaysia from well behind last year to up 18%
through July. Imports from Cameroon more than doubled
in July, while imports from Brazil and Congo
(Brazzaville) were both down more than 20%. Total
imports are down 33% for the year so far, but that number
is due to the removal of ipe and jatoba totals from the
category beginning this year.
When the two species are included, U.S. imports of sawn
tropical hardwood are up 21% so far this year versus last
year.
Meanwhile, Canadian import volumes of sawn tropical
hardwood fell for the third straight month in July. Monthly
imports dropped 6% as imports from Cameroon,
Indonesia, and Congo (Brazzaville) all continued to fall
sharply. Despite the decline, total imports are up 11%
year to date through July.
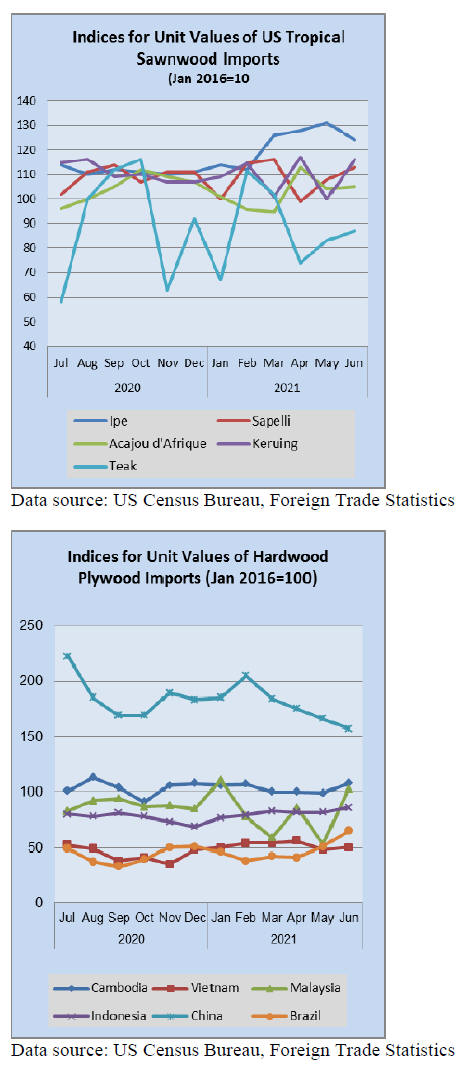
Hardwood plywood imports return to near record
levels
After cooling a bit in June, U.S. imports of hardwood
plywood returned to near record levels in July. Imports
rose 8% in July to 304,317 cubic metres in volume,
nearing the 10-year high set in May. Imports from
Vietnam rose 27% in July to more than twice the volume
of July 2020 and are now ahead 34% year to date.
Imports from Malaysia were also up sharply, rebounding
from a weak June number. Total imports are up 28% year
to date with all major trading countries seeing
improvement over last yearˇŻs volume.
Veneer imports surge comes to an end
Imports of tropical hardwood veneer fell 20% in July
ending a string of three months of consistent growth.
Imports from Ghana fell by 37% in July while imports
from Cote dˇŻIvoire dropped 62% and Imports from India
were off 18%.
Imports from China continued their recovery, gaining 36%
in July, while imports from Italy saw their strongest month
of the year, rising 29%. With the decline, total imports for
the year are now nearly even with 2020, up less than 1%
year to date.

Hardwood flooring imports recede
Much like veneer imports, US import volumes of
hardwood flooring also saw a hot streak come to an end in
July. Imports fell 18% in July as imports from China and
Brazil tailed off from yearly highs in June. Imports from
China were down 40% in July and are now 19% year to
date.
While imports from Brazil fell 23% in July, they are still
ahead by 131% year to date through July. Imports from
Malaysia, meanwhile, saw their best month of the year,
rising 213% to their highest level since September 2019.
Imports from Malaysia are up 40% year to date, about the
same as the rise in total imports which is at 39%.
Imports of assembled flooring panels rose for the fifth
straight month in July, gaining 9% for the month. Imports
from China gained 44% in July while imports from
Vietnam and Thailand also made gains of over 10%.
Imports from Canada fell 13% for the month.
While long-term comparisons are currently difficult in this
market (USDA added additional categories to the
Assembled Flooring Panels category in May) imports have
consistently trended upward throughout the summer.
Moulding imports stagnate
After four month of advancing, U.S. import volumes of
hardwood moulding fell 5% in July. A significant gain in
imports from Brazil (up 111%) was more than offset by
declines in imports from Malaysia (down 31%) and China
(down 15%).
Total year-to-date imports are up 14% with most exporting
countries well ahead of that mark through July. The
exception is imports from China, which are down 62%
year to date.
Wooden furniture imports remain steady
Imports of wooden furniture rose by less than 1% in July
as 2021 continues along record levels. With imports of
more than US$2.2 billion in July, imports remain at a level
more than 37% higher than the previous July and at a yearto-
date pace 60% above 2020.
Imports from Vietnam, India, and Mexico advanced, while
imports from Malaysia, Indonesia and Canada retreated.
Meanwhile, new orders for residential furniture continue
their rise, up 7% in June compared to 2020. This is
especially notable considering June 2020 was up 30% over
2019, and it marks 13 straight months of year-over-year
growth, as reported by Smith Leonard in the latest issue of
Furniture Insights.
An increase in new orders was reported by about 66% of
the residential furniture manufacturers and distributors
participating in the monthly survey.
Price driving consumers to opting for non-wood decks
Companies that make wood alternative decking materials
have boosted sales and grabbed market share, fueled in
part by rising lumber prices, and a home improvement
boom. Names such as Trex and Azek make decking
materials that typically mimic the look of wood but retain
their original appearance and in some circumstances
require less maintenance.
The trouble for many consumers is that these products
have typically been about twice the cost of lumber or
more. But skyrocketing lumber prices have led many
customers to take a second look at synthetics.
Right now, synthetic producers have about 20% share of
the decking market with lumber making up the balance.
Executives at Azek and Trex say they think there is room
to grow even beyond the extraordinary circumstances of
the coronavirus pandemic.
|