|
Report from
North America
Extent of slide in US imports revealed by stark
January-to-January comparisons
Although US imports of tropical hardwood and related
products showed significant growth in 2022 they have
experienced a steady regression in recent months. As the
decline continued into January this year, comparisons
versus January 2022 show imports now lagging far behind
the previous year. While not all products are down,
imports of hardwood plywood, sawn tropical hardwood
and wooden furniture have all begun 2023 significantly
weaker than the previous year.
Sawn tropical hardwood imports fall for fourth
consecutive month
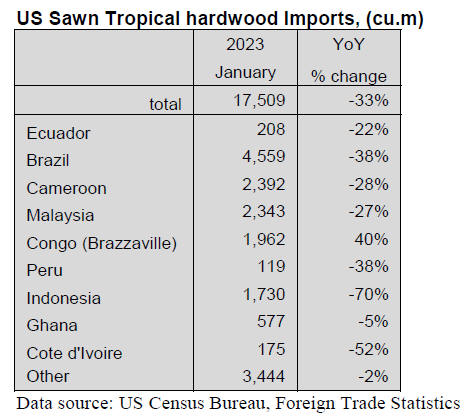
US imports of sawn tropical hardwood fell for a fourth
consecutive month in January. The 17,509 cubic metres
imported in January was down only 2% from December
but was 33% lower than that of January 2022. Imports
from most countries were down sharply from the previous
January with imports from Indonesia (down 70%) and
Cote d’Ivoire (down 52%) seeing the steepest declines.
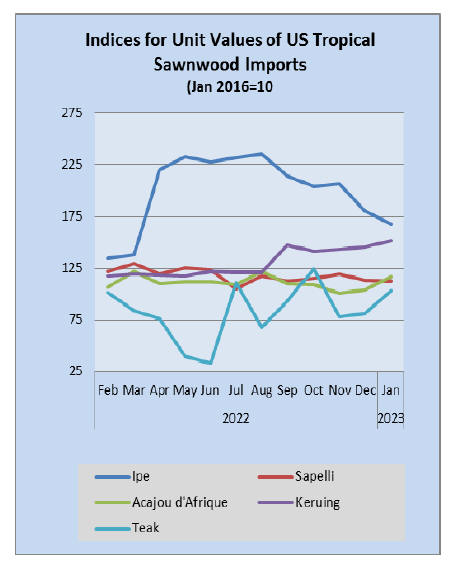
Imports of Ipe more than doubled from the previous month
but were still less than half that of last January, while
imports of Keruing fell 34% for the month and 26% from
the previous January. Imports of Sapelli, Jatoba, Teak and
Balsa also showed substantial losses for the month.
On the upside, imports of Cedro rose 41% in March and
were 40% better than the previous January, while
Mahogany imports were 45% better than last January
despite a 3% drop from December.
Canada’s imports of sawn tropical hardwood also fell in
January, decreasing 15% from the previous month. The
decline was due chiefly to a 20% drop in imports of
Sapelli. Despite the decline, overall imports were 11%
higher than January of last year. Canada imported more
than US$22 million of sawn tropical hardwood in 2022, up
36% over the previous year.
Hardwood plywood imports hit lowest level since 2010
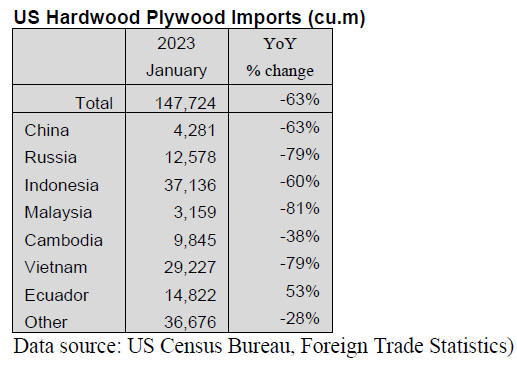
After two months of drastic declines, US imports of
hardwood plywood fell again in January this year but only
by a small margin. The 147,724 cubic metres imported in
January was 3% lower than the previous month, but a full
63% lower than in January 2022. This volume was the
lowest since December 2010.
Imports from several top trading partners actually
improved over December but was still well behind the
levels from a year ago—imports from Vietnam, for
example, gained 39% last month over the previous month,
but were 79% less than last January. After months of
volatility, imports from Russia have appeared to stabilize
at a reduced level, falling less than 1% for the month but
also down 79% from the previous January.
US veneer imports lag on weak Italy trade
US imports of tropical hardwood veneer fell 8% in
January despite large gains by some key trading nations.
Imports from India and Cameroon were both more than
double the previous month and made even higher gains
over January 2022. Even imports from Ghana and China,
which saw significant declines from the previous month,
still more than doubled January 2022 figures.
Yet, imports from Italy, the top trading partner, fell a
striking 76% from the previous month and 83% from the
previous January. While it appears other suppliers may be
gaining market share from Italy, veneer import figures
from Italy are often erratic and not predictable by season.
This will be worth watching in the next couple of months.
Total tropical hardwood veneer imports in January
outpaced those of January 2022 by 5%.
Hardwood flooring imports rise on surge from
Indonesia
US imports of hardwood flooring rose 7% in January as
imports from Indonesia continued to surge. Imports from
Indonesia rose 15% in January, gaining for the fifth
consecutive month.
At US$1.67 million, imports from Indonesia reached their
highest total since November 2012 and greatly outpaced
January 2022 imports, which were less than US$100,000.
Imports from China and Brazil both gained nicely versus
the previous month but were well behind last January with
imports from China down 29% and imports from Brazil
down 37%.
Imports from Malaysia were flat month-to-month and
down 14% from last January. Total imports in January
were up 17% over January 2022.
Imports of assembled flooring panels fell for the fourth
straight month, losing 7% in January. The decline from
last month was chiefly due to a 36% drop in imports from
Thailand and a 25% slide in imports from China.
Total imports are down by a massive 46% versus the
previous January, with imports from Thailand down 85%,
imports from China down 48%, and imports from Vietnam
down 41%.
Moulding imports down
US imports of hardwood moulding fell 8% in January,
dropping for a fourth consecutive month. A decline in
imports from China offset gains in imports from Malaysia
and Brazil.
The 26% drop in imports from China left January imports
from China at less than half of their January 2022 level,
and despite their rise from December’s figures, imports
from Malaysia were 44% off their January 2022 pace.
Total imports of hardwood moulding are down 22% from
the previous January.
US wooden furniture imports begin to recover
US imports of wooden furniture rose 6% in January,
stemming a steady slide from the record levels set in the
summer. The US$1.8 billion in January imports is 15%
below the January 2022 figure. The gain was due to
increasing imports from India (up 38%) and Indonesia (up
25%). Despite small gains for the month from most
trading partners, imports from most counties are down
versus a year ago. The exception is imports from Canada,
which are up 10% from last month and up 8% from the
previous January.
US cabinet sales rose 16% in 2022, continued growing
in January
According to the Kitchen Cabinet Manufacturers
Association’s monthly Trend of Business Survey,
participating cabinet manufacturers reported an increase in
overall cabinet sales of 6.5% for January 2023 compared
to the same month in 2022.
KCMA reported that 2022 sales topped those of 2021
across the board. Overall cabinet sales were up 16.4% for
the year, custom sales rose 17.8%, semi-custom gained
17.4%, and stock sales rose 15.5%. KCMA Survey
participants include stock, semi-custom and custom
companies whose combined sales represent approximately
75% of the US kitchen cabinet and bath vanity market.
See:
https://kcma.org/insights/january-trend-business-report
|