|
Report from
North America
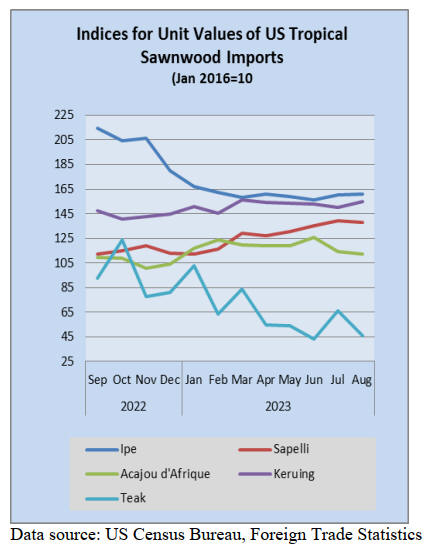
US imports of sawn tropical hardwood rise for
third
month
US imports of sawn tropical hardwood rose for a third
consecutive month in August gaining 3% from the
previous month. The 19,329 cubic metres imported in
August was 7% higher than in August 2022 and was the
highest-volume month of the year so far. The gain came
despite the fact that imports from Brazil, the top US
trading partner, fell by 30%. The shortfall was more than
made up for by gains in imports from Cameroon (up 65%),
Congo/Brazzaville (up 41%), Indonesia (up 31%), and
Malaysia (up 21%).
Imports of Acajou d’Afrique more than tripled in August,
while imports of Mahogany, Keruing, Iroko, and Padauk
also made strong gains. Imports of Balsa and Ipe both
declined by slightly more than a third.
Imports are making up ground but are still down 31%
versus last year through August. Year to date imports of
most woods still trail last year by a large margin, except
for imports of Keruing, which are up 19% versus last year.
Canadian imports of sawn tropical hardwood rose 6% in
August as imports from Ghana gained 38% and imports
from Cameroon improved 25%. Compared with the
previous August, imports were up by 2%. For the year so
far, Canadian imports of sawn tropical hardwood are down
by 12% through August.
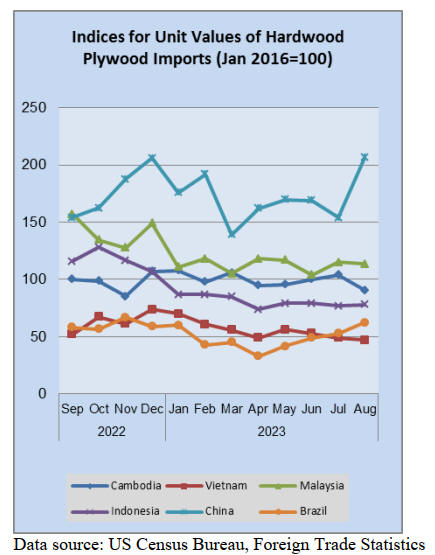
Hardwood plywood imports end upward streak
The volume of US imports of hardwood plywood fell by
22% in August ending a run of five consecutive months of
gains. The 276,051 cubic metres of plywood imported last
month was 10% lower than that of August 2022 imports.
Despite the decreased volume, August imports managed to
climb 3% when measured in dollars. The decline in
volume was chiefly due to a 45% drop in imports from
China and a 45% combined drop from countries not
considered among the top US trade partners. The volume
from most key trading nations rose in August with imports
from Cambodia rising 18%, imports from Malaysia grew
25% and imports from Russia more than doubled. Total
year-to-year imports are down 39% through August.
US veneer imports rise
US imports of tropical hardwood veneer surged 63% in
August reaching their highest level of the year. While
imports for the month fell 12% short of August 2022
levels, last August was a record setting month and the
US$4.8 million of veneer imported was comfortably above
the August average for the last five years.
Imports from Cameroon more than doubled in August and
were responsible for over half the month’s total. Imports
from Ghana and Cote d’Ivoire were also up sharply.
Because last August saw such strong imports, the year-to-
year comparison fell back into the red in August with total
2023 imports down 1% versus 2022 through August.
Imports from Italy are down 71% for the year so far while
imports from most other trade partners are up for the year.
US imports of hardwood flooring edge upward
US imports of hardwood flooring rose 4% in August. A
78% gain in imports from Malaysia more than offset
declines in imports from China (down 54%), Indonesia
(down 12%) and Brazil (down 11%). While imports from
Indonesia were down for the second straight month, they
are still holding at near three times what they were in
August 2022.
For the year, imports from Indonesia are up 175% over
2023 through August, taking market share from China,
which is behind last year by 42% and Brazil, which is
down 58%. Total US imports of hardwood flooring are up
4% so far this year.
Imports of assembled flooring panels fell 3% in August,
ending a four-month run of growth. Imports from
Indonesia were off 51% while imports from China rose
38% for the month. Imports for the year so far are down
34% versus last year with imports from China off by 64%
and imports from Thailand down by a full 80%.
Moulding imports drop 13%
US imports of hardwood moulding showed less volatility
in August than in recent months, but still fell 13% as
imports from chief supplier,Canada, also fell 13%. The
August total was 25% below that of the previous October
as import levels remain well behind last year.
On the positive side, imports from Brazil rose 36% in
August and are now “only” down 33% year-to-year vs.
2022. Imports from China are off by 67% vs. 2022 despite
a 9% gain in August. Overall imports are down 31%
versus last year through August.
US wooden furniture imports improve
US imports of wooden furniture held firm in August,
rising 2% after falling the previous two months. At
US$1.7 billion, imports were 18% less than the previous
August. Imports from Malaysia, which have been lagging
more than any other trading partner so far this year, gained
a healthy 16% in August.
Imports from China continued to flag, falling 9% in
August. Imports from Malaysia and China are behind 2023
pace by 42% and 38%, respectively, through August. Total
wooden furniture imports are down 27% versus 2022 so
far this year.
Wood kitchen cabinets making a comeback says
trends report
The National Kitchen & Bath Association, representing
nearly 50,000 North American kitchen and bath industry
professionals, has released its 2024 Kitchen Trends
Report. According to the report, the focus over the next
three years will remain on multi-function designs, easy-to-
clean kitchens with ample storage, eat-in dining areas,
sustainable materials and advanced technology.
And while white cabinetry has been a staple in kitchens
for years, designers now say that wood cabinetry is
making a comeback. When asked about popular kitchen
color trends, “wood” was cited by 28% of respondents,
outpacing “white”, which was cited by 25%.
The report also identified a connection to the outdoors as
an emerging theme, with designers layering warmer
whites, earthy greens and wood tones to create a sense of
nature, calm and harmony. Also in vogue are gold faucets,
textured backsplashes, and the color green.
See:
https://www.woodworkingnetwork.com/news/woodworking-industry-news/nkba-releases-its-2024-kitchen-trends-report
|