US Dollar Exchange Rates of
10th
June
2026
China Yuan 6.78
Report from China
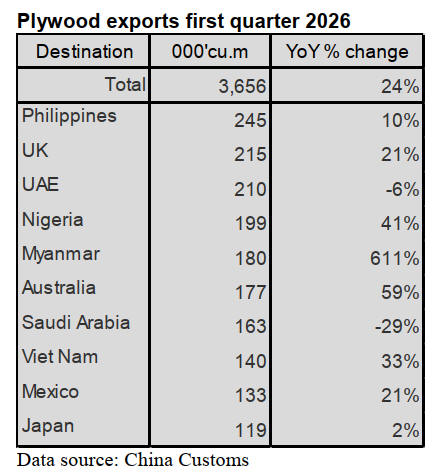
Plywood exports increased in the first quarter
According to China Customs, plywood exports in the first
quarter of 2026 totalled 3.656 million cubic metres, up
24% over the same period of 2025.
The Philippines and the UK were the first and second
largest destinations for China’s plywood exports. China’s
plywood exports to these two countries rose 10% and 21%
respectively in the first quarter of 2026.
China’s plywood exports to the third largest destination
country, the UAE, declined 6% in the first quarter of 2026.
The countries and regions for China’s plywood exports are
numerous and the proportion of China’s plywood exports
to the top 10 destination countries in the first quarter of
2026 accounted for just 50% of the national total in the
first quarter of 2026.
China’s plywood exports to Nigeria, Australia, Viet Nam
and Japan grew 41%, 59%, 33% and 2% in the first
quarter of 2026.
In contrast, the volume of China’s plywood exports to
Saudi Arabia fell 29% among the top destination countries
in the first quarter of 2026.
The key factors behind the rise in exports were the price
advantage, the shift in demand and support from
government policies and the high production capacity.
Indonesia's plywood exports plummeted to 622,000 cubic
metres, down 26% year-on-year in the first quarter of
2026, with exports to the US dropping by 60%, resulting
in the loss of market share in the United States, the Middle
East and Southeast Asia.
The average price of China’s plywood exports in the first
quarter was US$$343 per cubic metre, a year-on-year
decrease of 6%, which is approximately 40% lower than
that in Indonesia. Given the scale of production and
automation of the processes there was a strong capacity for
rapid delivery, high container loading rate and low
logistics costs.
The production capacity in China is large and the sector
benefits from the Regional Comprehensive Economic
Partnership (RCEP) and export tax rebates.
. Cluster production of plywood in Shandong Province and
Guangxi Zhuang Autonomous Region. has been expanded
and the supply of fast-growing timber such as eucalyptus
is stable.
The RCEP origin verification process has been accelerated
and export tax rebates are stable and subsidies for non-
formaldehyde glue support product upgrades are provided.
The proportion of E0/ENF grade formaldehyde-free
plywood has increased meeting the formaldehyde
emission requirements in Europe and the United States.
Surge in plywood exports to Myanmar
According to China Customs, plywood exports to
Myanmar surged over 600% in the first quarter of 2026.
This was the result of a combination of four factors,
China's production capacity advantage, the domestic
supply-demand gap in Myanmar, the convenient
geographical logistics and bilateral trade policies. This
growth of exports is expected to continue throughout the
year since China has become the main source for
Myanmar's plywood imports.
The total volume of wood panel trade along the China-
Myanmar border has seen a significant increase and
plywood has become the core growth driver of the export
trade.
The main reasons for the surging China’s plywood exports
to Myanmar are said to be:
The Chinese plywood industry is mature and of a large-
scale production with a high degree of automation. It has
the capacity to supply plywood products of various
specifications and grades fully meeting the diverse
demands of Myanmar.
Chinese plywood has a significant advantage in terms of
cost performance. Compared with locally produced
plywood in Myanmar and imported plywood from other
Southeast Asian countries, it has extremely strong price
competitiveness.
The product range is comprehensive covering both
ordinary building materials and specialised plywood for
furniture production. Chinese products are fully available
and of stable quality enabling precise alignment with
various purchasing demands in the Myanmar market.
Reduced costs and enhanced efficiency in logistics
delivers export advantages.
Because direct
transportation via multiple border crossings
between China and Myanmar is possible there is no need
for ocean shipping. The transportation route is short and
highly flexible. The charges for plywood shipped to
Myanmar is 30% to 40% cheaper than to other ASEAN
destinations and delivery times are only 7-10 days.
The China-Myanmar Economic Corridor continues to
make steady progress. The Customs clearance procedures
at the border have been simplified and the inspection
efficiency has been enhanced. The widespread use of
direct RMB cross-border settlement has effectively
reduced exchange rate losses and trade handling costs,
significantly improving the efficiency of China's exports.
The gap between supply and demand of plywood in
Myanmar continues to widen.
The industrial
foundation in Myanmar is weak and there is
no capacity for large-scale processing of plywood.
Domestic production of plywood in Myanmar is of limited
variety which cannot meet the demands in the domestic
market.
In the first quarter of 2026, the infrastructure construction,
furniture manufacturing and house renovation sectors in
Myanmar experienced a rapid recovery. The demand for
building materials was high further widening the gap
between local production capacity and demand. Many
sectors are highly dependent on imported building
materials.
Due to sanctions imposed by Europe and the United States
and the restricted foreign trade channels, Myanmar has
difficulty importing high-quality and cost-effective
building materials from Europe and the United States as
well as from Southeast Asian countries. Therefore,
Chinese building materials such as plywood have become
the preferred alternative category for its imports.
The bilateral trade environment continues to be favorable
for exports. China and Myanmar have been continuously
implementing preferential policies for the border trade.
Plywood exporters enjoy Customs clearance convenience
and tax and fee reductions which significantly lowers the
plywood export costs for Chinese enterprises to Myanmar.
Myanmar will reportedly relax restrictions on the import
of building materials, lower tariffs on wood panels and
simplify the import registration process. This will be
beneficial for large-scale imports of plywood from China
into the Myanmar market.The pattern of processing and
border trade cooperation zone along the China-Myanmar
border has matured.
Relying on the synergy of border industries, the system for
plywood transfer, packaging and local distribution is well-
established, further facilitating the large-scale export of
Chinese plywood to various markets in Myanmar.
China's advantage in plywood production capacity, the
strong demand gap in Myanmar, the geographical logistics
benefits and the favorable policies will continue. The high
growth trend of China's plywood exports to Myanmar will
also continue and the bilateral plywood trade volume is
expected to further expand.
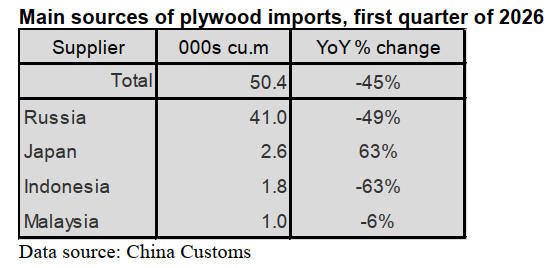
Decline in plywood imports from Russia
Russia still is the largest supplier of China’s plywood
imports accounting for 82% of the national total plywood
imports however, in the first quarter of 2026, China’s
plywood imports from Russia dropped 49% over the same
period of 2025 directly resulting in the large decline of the
national plywood imports in the first quarter of 2026.
In the first quarter of 2026, import volumes of plywood in
China dropped significantly. The main reason was the
combined effect of four factors, namely the collapse of
domestic demand, the strengthening of domestic
substitution, the increase in international costs and trade
and seasonal disturbances.
In the first quarter the area of new construction started was
down by 203% year-on-year and the area of completed
construction was down by 25%. The demand for
buildings, decoration materials and furniture also shrank.
The output of wooden furniture only increased by 0.15%,
export orders weakened, manufacturers reduced
production and inventory and they reduced imports.
Factories were shut down in February 2026 during Spring
Festival. The timber trade volume in that month decreased
by 31% compared with the previous month, dragging
down the overall imports in the first quarter of 2026.
Domestic substitution accelerated and import demand was
squeezed. High-yield planted forests of fast-growing
species such as poplar and eucalyptus have reached the
peak of rotation period.
New production lines have been added in regions like
Shandong province and Guangxi Zhuang Autonomous
Region. The middle and low-end plywood markets are
basically self-sufficient, reducing reliance on imports from
Southeast Asia and Russia.
The increase in international supply and landed prices
have led to a decline in the cost-effectiveness of imports.
Major producing countries such as Indonesia and Malaysia
raised plywood prices and experienced reduced production
during the rainy season, leading to an increase in export
prices. Russia supplies were affected by the strengthening
ruble and rising energy costs and thus saw a year-on-year
decrease of 49% in its exports of plywood to China.
The tense situation in the Strait of Hormuz led to some
routes changing to the Cape of Good Hope, causing freight
rates to rise by 30%-50%, further pushing up the landed
prices.
Exchange rate fluctuations. The depreciation of the RMB
against the US dollar has led to an increase in import
costs, weakening plywood purchasing.
Trade barriers and policy disturbances have impacted
exports. The spillover effect of high tariffs in the United
States through the 267% comprehensive tariff on Chinese
plywood forces domestic production capacity to shift
towards domestic sales, thereby squeezing out import
space.
Higher quarantine standards have led to difficulties in the
clearance of some low-quality plywood from Southeast
Asia due to issues such as formaldehyde and insect
damage, resulting in restricted plywood import volumes.
In the first quarter of 2026 China’s plywood imports
totalled 50,000 cubic metres, down 45% over the same
period of 2025.
Malaysia and Indonesia used to be the main suppliers of
plywood to China in the past, but China’s plywood
imports from Indonesia and Malaysia declined 63% and
6% respectively in the first quarter of 2026 their status in
China further decline.
In contrast, China’s plywood imports from Japan rose
63%.
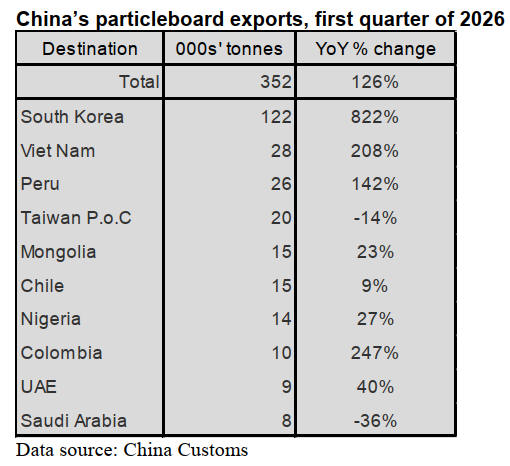
Surge in particleboard exports
According to China Customs, particleboard exports in the
first quarter of 2026 totalled 352,000 tonnes valued at
US$110 million, surging 126% in volume and 40% in
value over the same period of 2025.
China’s particleboard exports to the top three destinations,
namely South Korea, Viet Nam and Peru surged over
800%, 200% and 140% respectively over the same period
of 2025. In addition, China’s particleboard exports to
Colombia also surged over 240% in the first quarter of
2026.
Taiwan P.o.C was the fourth largest destination for
China’s particleboard exports in the first quarter of 2026
but down 14% over the same period of 2025. China’s
particleboard exports to Saudi Arabia fell 36% in the first
quarter of 2026.
The main reasons for the significant increase in China's
particleboard exports are as follows.
Expansion of ASEAN furniture assembly businesses and
the furniture production capacity in Viet Nam and
Indonesia has significantly increased. There is a shortage
of flooring materials in the Chinese domestic market so
emergency replenishment of Chinese ENF grade
formaldehyde-free particleboard has been implemented in
the first quarter of 2026.
California and other regions in the US have implemented
mandatory standards for formaldehyde-free particleboard.
Chinese E0/ENF grade particleboard products have
replaced the production capacity gaps in Europe and North
America.
Realisation of RCEP tariff benefits. The agreement tariffs
on particleboard were further reduced in the first quarter of
2026 along with the optimisation of the rules of origin.
The particleboard export costs to ASEAN and the Middle
East have significantly declined.
There has been a significant improvement in the
competitiveness of domestic particleboard industries
especially in terms of environmental protection and
compliance. The proportion of E0/ENF grade
particleboard products exceeds 52% and formaldehyde-
free particleboard has become mainstream.
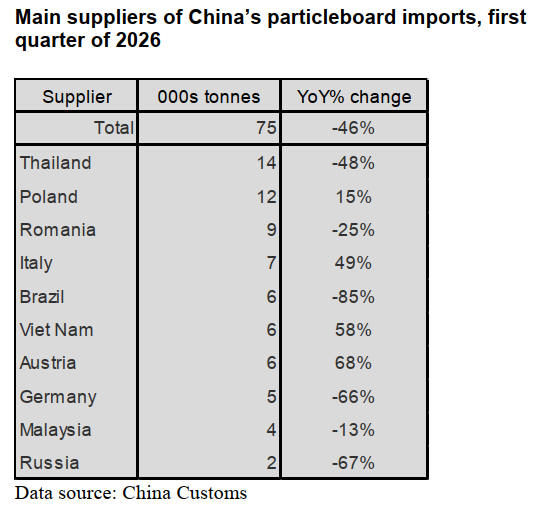
Significant decline in particleboard imports from
Thailand
According to China Customs, particleboard imports from
Thailand dropped 48% in the first quarter of 2026.
Thailand was the largest supplier for China’s particleboard
imports so that China's overall imports of particleboard
sharply declined in the first quarter of 2026. China’s
particleboard imports in the first quarter of 2026 totalled
75,000 tonnes, down 46% over the same period of 2025.
In the first quarter of 2026, China's imports of
particleboard from Thailand sharply decreased. The main
reason for the decrease in imports from Thailand are said
to be.
Chinese particleboard capacity has expanded. New
particleboard production capacity will exceed 12 million
cubic metres by the end of 2026 with ENF grade
formaldehyde-free particleboard accounting for 52% or
more.
The cost of Chinese ENF grade particleboard is from
US$220 to US$240 per cubic metre, while the cost of
particleboard imported from Thailand is around US$280
per cubic metre. The cost of European particleboard is
even higher such that the cost advantage of China’s
particleboard is overwhelming.
Leading custom furniture enterprises such as OPPEIN and
Suofeiya have reduced import purchases and prioritised
domestic F4-star/ENF grade particleboard. The import
dependency of particleboard has dropped to 9%.
In the first quarter of 2026, the completed area of
residential buildings in China decreased by 26% year-on-
year. The construction of finished houses slowed down,
and the demand for high-end imported decorative panels
declined.
Weakness in furniture and home decoration sector remains
a factor. Consumption of particleboard has been weak and
enterprises have been reducing inventory and controlling
costs. Further, the willingness to purchase high-priced
imported particleboard dropped significantly.
|